The RMI Indicator for MT5, also known as the Relative Momentum Index, is an improved version of the classic Relative Strength Index (RSI). This oscillator-based indicator offers traders a more accurate view of market momentum and potential reversals by combining the strength of RSI with the precision of momentum analysis.
Unlike the RSI, which compares consecutive price changes, the RMI measures the momentum of a specific period, making it smoother, faster, and more responsive. This allows traders to spot market reversals earlier and make more informed trading decisions.
The RMI indicator works effectively on all chart timeframes, including daily, weekly, and monthly, as well as intraday charts. Both beginner and professional traders can use it to identify overbought, oversold, and divergence signals with ease.
How the RMI Indicator Works
The Relative Momentum Index (RMI) measures the momentum of price movements over a set period, providing insight into when the market may be overextended. It displays an oscillator line that fluctuates between 0 and 100, similar to the RSI.
Above 70 → The market is in the overbought zone (potential SELL setup).
Below 30 → The market is in the oversold zone (potential BUY setup).
The RMI improves upon the RSI by comparing the current price with the price from a fixed number of bars back, rather than consecutive bars. This makes it less noisy and more adaptive to real market conditions.
Because of this enhanced calculation method, the RMI responds better to momentum changes while filtering out minor fluctuations that might cause false RSI signals.
RMI Indicator for MT5 Trading Signals
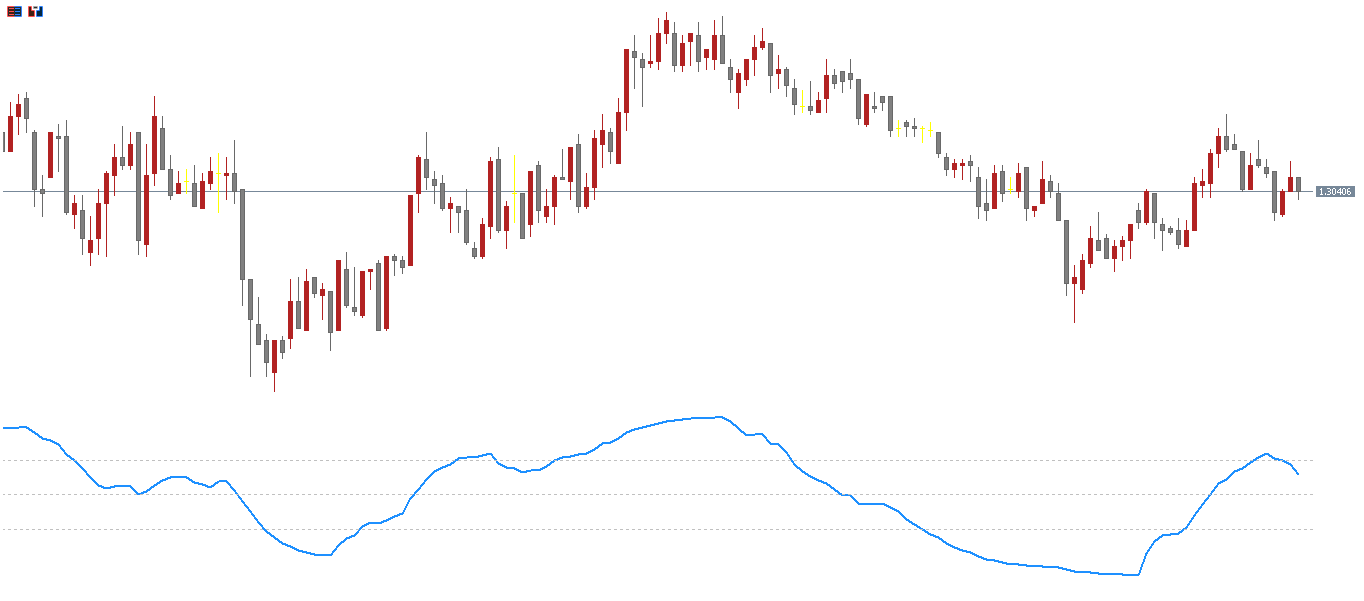
The EUR/USD H4 chart shown above demonstrates how the RMI indicator behaves in real trading conditions. The indicator line oscillates between 30 and 70 levels, which represent the standard oversold and overbought thresholds.
Sell Signal (Overbought Zone)
When the RMI value rises above 70, the market is considered overbought.
Traders should wait for the RMI line to cross back below 70 to confirm a SELL signal.
A stop loss can be placed above the recent swing high.
Hold the position until the opposite (BUY) signal appears.
Buy Signal (Oversold Zone)
When the RMI drops below 30, the market is in an oversold condition.
Wait for the indicator to rise back above 30 to confirm a BUY signal.
A stop loss should be set below the previous swing low.
Profit-taking can be managed by closing trades when an opposite signal is generated.
This simple yet powerful setup allows traders to follow the market’s momentum while keeping risk under control.
Chart Patterns and Divergence Signals
Apart from identifying overbought and oversold levels, the RMI Indicator for MT5 can also help detect chart patterns and divergence — two essential tools for predicting market reversals.
Pattern Recognition
The RMI often forms recognizable chart structures such as:
Double Tops – signals potential bearish reversal.
Double Bottoms – signals potential bullish reversal.
Head and Shoulders – indicates trend exhaustion.
These formations provide early warnings before significant market moves, allowing traders to prepare in advance.
Divergence Trading
Divergence occurs when the RMI and price move in opposite directions.
Bullish Divergence: Price makes lower lows, but the RMI makes higher lows → potential uptrend reversal.
Bearish Divergence: Price makes higher highs, but the RMI makes lower highs → potential downtrend reversal.
Divergence signals are considered leading indicators, often preceding price reversals, making them extremely useful for swing and position traders.
Best Settings and Timeframes
The RMI indicator works well on all timeframes, but for best accuracy, traders should focus on H4, Daily, and Weekly charts.
Recommended Settings:
RMI Period: 14 (default)
Overbought Level: 70
Oversold Level: 30
Scalpers and intraday traders can adjust the settings (e.g., shorter periods) for more responsive signals, while long-term traders may prefer higher periods for smoother results.
Advantages of Using the RMI Indicator
The RMI Indicator for MT5 offers several benefits over the traditional RSI and other oscillators:
More responsive to momentum changes – ideal for fast-moving markets.
Reduces false signals in volatile conditions.
Supports RSI-based strategies with improved precision.
Identifies divergence and chart patterns for early reversal detection.
Works on all instruments – Forex, stocks, indices, and commodities.
Free to download and easy to install on MT5.
These advantages make it a reliable upgrade for traders already familiar with RSI strategies but seeking better timing and accuracy.
Trading Tips for the RMI Indicator
To maximize accuracy, combine the RMI with other technical indicators such as:
Moving Average (MA): Confirm trend direction before taking trades.
MACD: Use for momentum confirmation.
Support/Resistance Zones: Align RMI signals with key price levels.
Price Action Patterns: Validate signals with candlestick formations like engulfing bars or pin bars.
This multi-layered approach improves signal quality and minimizes false entries.
Conclusion
The RMI Indicator for MT5 is a powerful evolution of the classic RSI, offering enhanced sensitivity and responsiveness to market momentum. Traders who rely on RSI-based strategies will find the RMI a valuable upgrade, thanks to its ability to detect overbought/oversold zones, divergences, and pattern-based setups with higher precision.
Whether you’re a beginner or a seasoned trader, the RMI Indicator provides all the necessary tools to improve your trading results. Download it for free, install it on your MT5 platform, and start using it to refine your entries and exits today.
FAQ
The RMI (Relative Momentum Index) Indicator measures momentum strength similar to RSI but with improved smoothing. It helps identify overbought and oversold conditions, potential trend reversals, and momentum strength, providing traders with clearer signals than traditional momentum oscillators.
When RMI rises above 70, it typically indicates overbought conditions and potential downward reversal or sell opportunities. When RMI falls below 30, it suggests oversold conditions and potential upward reversal or buy opportunities. These levels help identify potential turning points.
RMI uses a modified calculation that provides improved smoothing compared to RSI, reducing false signals and making momentum readings more reliable. This makes RMI particularly useful in trending markets where traditional RSI can give false overbought/oversold readings.
Use RMI to identify momentum conditions and potential reversals. Enter long trades when RMI moves out of oversold territory and turns upward, and enter short trades when RMI moves out of overbought territory and turns downward. Always confirm with price action or trend indicators.
Yes, RMI works on all MT4 timeframes and currency pairs. It is suitable for scalping, day trading, and swing trading, though many traders find it most effective on H1 and H4 charts where momentum signals are clearer and more reliable.
2 Downloads
Published:
Nov 05, 2025 13:20 PM
Category: