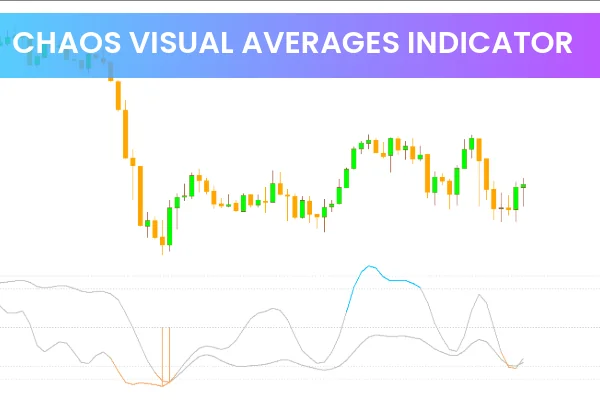
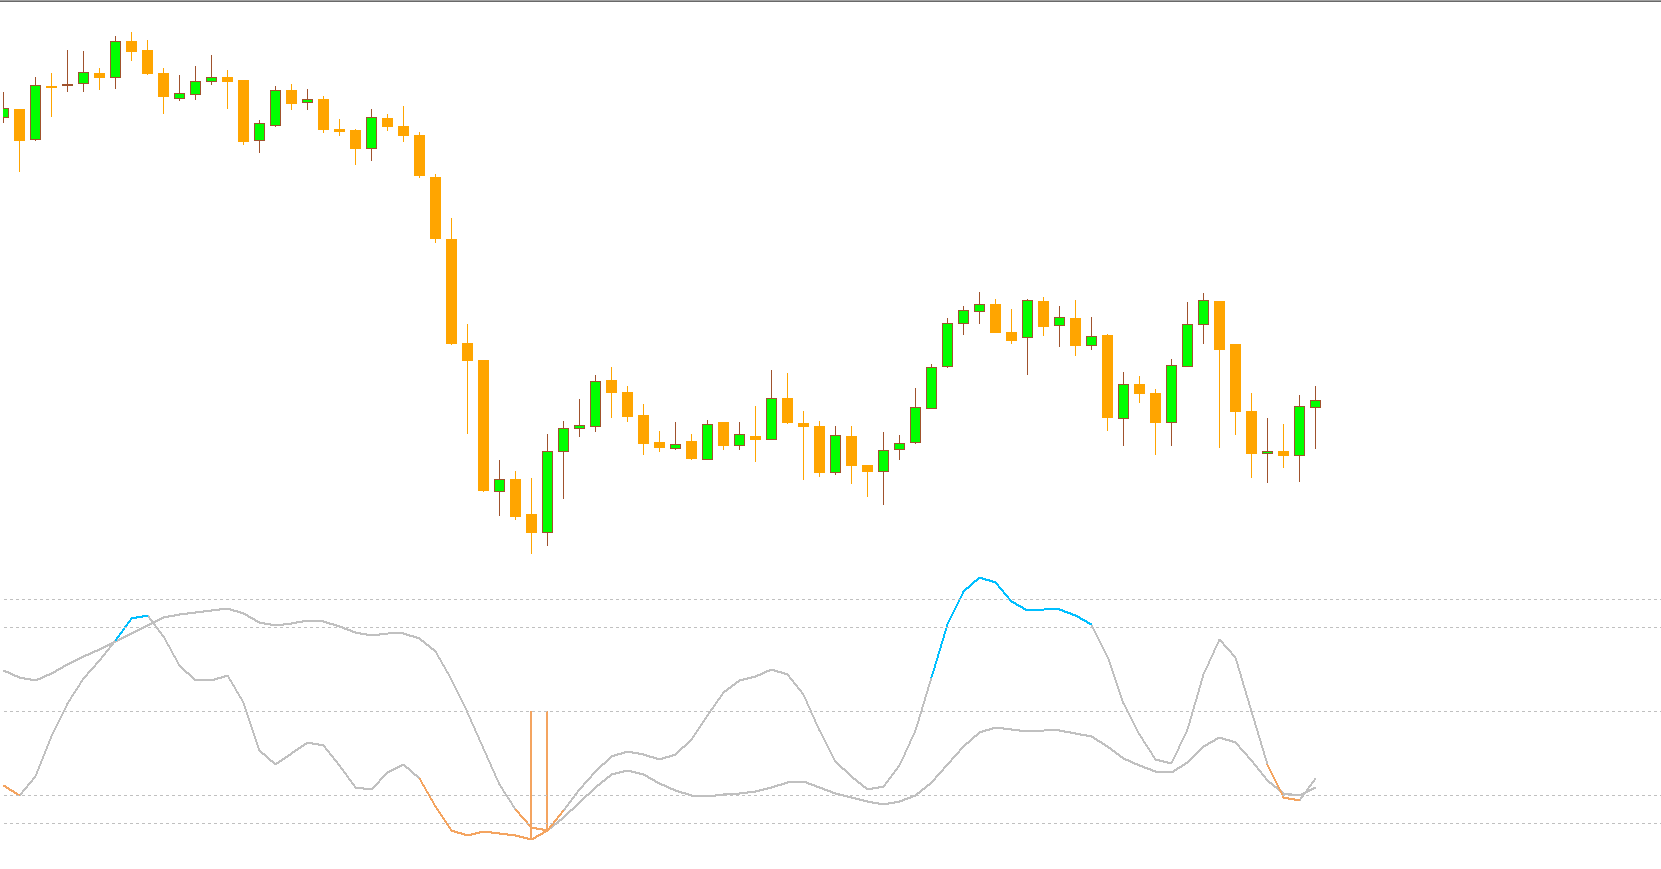
The Chaos Visual Averages Indicator for MetaTrader 4 (MT4) is a highly effective oscillator-based Forex Indicator that helps traders identify potential reversal points in the market using the Williams’ Percentage Range (WPR). Unlike a single WPR, this indicator uses two WPR lines, which makes it more responsive and accurate in spotting overbought and oversold zones.
By combining dual WPR crossovers with visual color cues, the Chaos Visual Averages Indicator provides clear buy and sell opportunities that can be used across all timeframes — from Scalping on M15 charts to swing trading on H4 or daily charts. Its simplicity and visual clarity make it suitable for both beginner and professional traders.
How the Chaos Visual Averages Indicator Works
The indicator plots two WPR lines that move within the traditional overbought and oversold boundaries. The crossover of these two lines at market extremes generates high-probability entry signals.
When the market reaches extreme levels:
The Silver WPR lines turn Blue to indicate an overbought condition, signaling a possible sell opportunity.
The Silver WPR lines turn Red to indicate an oversold condition, signaling a potential buy opportunity.
These color-coded signals make the indicator easy to interpret without the need for complex analysis.
Additionally, the indicator includes an alert feature, notifying traders when the crossover occurs in an overbought or oversold area. This allows you to act promptly when trading opportunities arise.
How to Trade with the Chaos Visual Averages Indicator for MT4
The following strategy can help you use the Chaos Visual Averages Indicator effectively in your forex trading:
Sell Setup (Overbought Condition)
Wait for the WPR lines to enter the overbought zone (usually above -20).
When one or both lines exit the overbought area and cross downward, it signals a potential sell opportunity.
Confirm with Price Action — look for bearish candlestick patterns or resistance rejections.
Place your stop loss above the recent swing high.
Buy Setup (Oversold Condition)
Wait for the WPR lines to enter the oversold zone (below -80).
When one or both lines exit the oversold area and cross upward, it indicates a buy signal.
Confirm using bullish price action or support zone bounce.
Place your stop loss below the previous swing low.
Combine with Other Indicators
To reduce false signals, the Chaos Visual Averages Indicator can be used alongside:
Moving Averages – to confirm trend direction.
MACD or RSI – to verify momentum strength.
Support/Resistance Zones – to find confluence with price structure.
This combination ensures that trades are entered in alignment with both trend and momentum.
Advantages of Using the Chaos Visual Averages Indicator
Clear Buy/Sell Alerts: The crossover signals are easy to read with distinct color changes for fast decision-making.
Accurate Market Extremes Detection: Dual WPR setup improves signal precision compared to the traditional WPR.
Versatile Across Timeframes: Works effectively for scalping, day trading, and swing trading strategies.
Customizable Alerts: Audio or pop-up alerts notify traders when crossover conditions are met.
Beginner-Friendly Interface: Clean, visual design allows for simple interpretation of complex market behavior.
Conclusion
The Chaos Visual Averages Indicator for MT4 is a powerful oscillator tool designed to help traders identify reversal zones and momentum shifts through dual WPR crossovers. By visually marking overbought and oversold areas and providing alert notifications, it allows traders to react quickly to changing market conditions.
Whether you’re a short-term scalper or a long-term swing trader, this indicator can enhance your ability to capture profitable entries and exits with greater confidence.
Download the Chaos Visual Averages Indicator for MT4 today from IndicatorForest.com and upgrade your forex trading strategy with precision-driven reversal signals.
FAQ
3 Downloads
Published:
Nov 07, 2025 13:07 PM
Category: