The Da Vinci Indicator is a groundbreaking trading tool that merges three of the most trusted technical indicators — Bollinger Bands, Commodity Channel Index (CCI), and Relative Strength Index (RSI) — into a single, efficient system. This unique combination provides traders with precise buy and sell signals, helping them identify profitable opportunities across forex, stocks, and commodities markets.

By integrating these proven methods, the Da Vinci Indicator simplifies technical analysis and offers traders of all experience levels a clear, confident way to approach the markets.
The Da Vinci Indicator trading signals are generated by analyzing the interaction between Bollinger Bands, CCI, and RSI. Each component adds a distinct layer of confirmation, creating a highly reliable multi-signal system:
Bollinger Bands help visualize volatility and potential reversal zones. When price reaches the upper band, it suggests possible overbought conditions; when it hits the lower band, it may indicate an oversold situation.
The CCI measures the strength and direction of market momentum. A high positive CCI value signals strong upward momentum (overbought), while a low negative value indicates potential downside momentum (oversold).
The RSI reinforces these findings by evaluating whether an asset is overbought or oversold based on recent price movements. RSI values above 70 typically signal overbought conditions, while values below 30 suggest oversold zones.
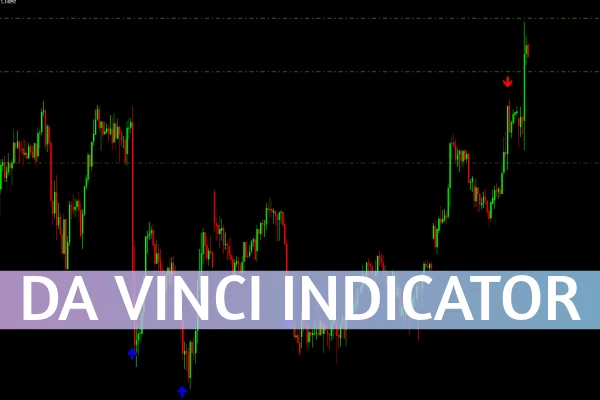
When the CCI and RSI both identify oversold conditions and the price touches the lower Bollinger Band, the Da Vinci Indicator generates a blue arrow, signaling a potential buy entry.
Conversely, when both indicators confirm overbought conditions and the price hits the upper Bollinger Band, a red arrow appears, indicating a sell opportunity.
This three-layer confirmation strategy minimizes false signals and enables traders to focus on high-probability setups. The result is enhanced accuracy and confidence in trade execution — a must-have for any serious trader.
✅ Multi-confirmation system: Reduces false signals through integrated analysis.
✅ Easy to interpret: Arrows provide straightforward visual cues for entries and exits.
✅ Versatile: Works effectively across forex, stocks, and commodities.
✅ Time-saving: Combines multiple analyses into one indicator.
✅ Confidence in trading: Offers clarity and precision even in volatile markets.
The Da Vinci Indicator’s strength lies in its synergistic approach — combining momentum, volatility, and strength indicators into one cohesive signal system. This reduces confusion from conflicting indicators and provides consistent trading insights across different market conditions.
Whether you are a day trader, swing trader, or long-term investor, this tool helps you stay aligned with the market’s true direction.
The Da Vinci Indicator stands out as one of the most advanced and user-friendly tools in technical analysis. By merging Bollinger Bands, CCI, and RSI, it delivers high-accuracy trading signals that help reduce risks and maximize profits.
Take your trading strategy to the next level — download the Da Vinci Indicator today and experience clarity, precision, and confidence in every trade.
👉 Visit IndicatorForest.com to explore the Da Vinci Indicator and other powerful MT4 and MT5 tools designed to enhance your trading performance.
Published:
Oct 28, 2025 22:27 PM
Category: