Uncover Market Conviction with the BSP Indicator for MT4
In the highly competitive world of Forex trading, Price Action alone often fails to tell the complete story. To truly understand where a currency pair is headed, you must look beneath the surface at the forces driving the move. The BSP (Buying Selling Pressure) Indicator for MetaTrader 4 (MT4) is a specialized volume-proxy tool designed to quantify the intensity of market participants. By measuring the "weight" behind every price fluctuation, the BSP Indicator empowers traders to identify high-conviction trends and avoid the dangerous traps of low-liquidity exhaustion.
Quantifying Market Intensity
The BSP Indicator operates on the fundamental principle that price follows pressure. In a healthy market move, price expansion should be supported by a corresponding increase in buying or selling intensity. When price rises but the "buying pressure" remains flat or declines, it signals a lack of professional interest—a classic warning of an impending reversal.
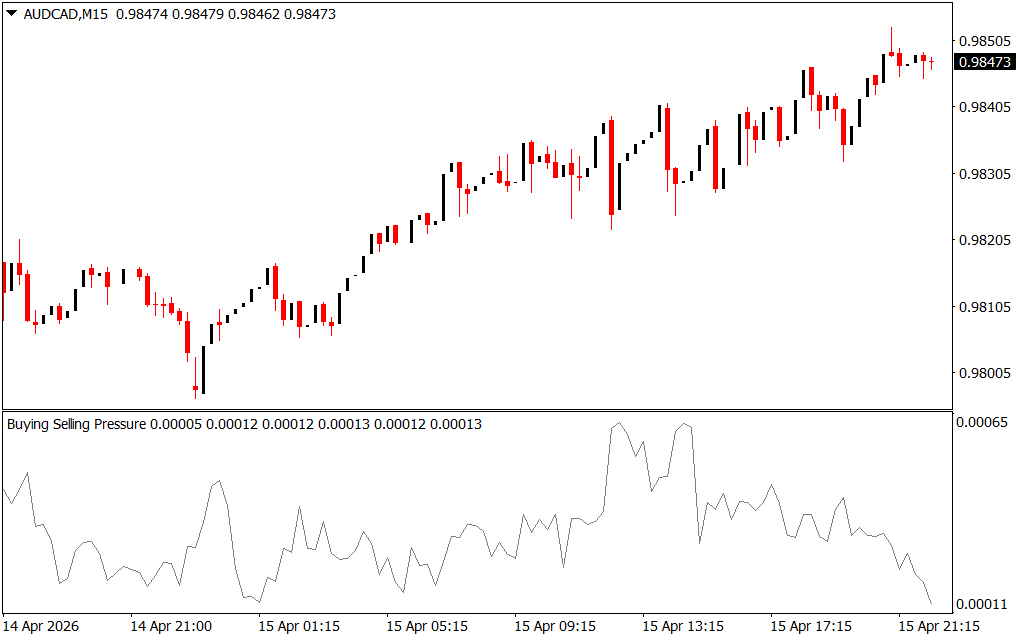
As demonstrated in the recent AUD/CAD M15 chart analysis, the indicator provides a streamlined, single-line visual in the sub-window:
- The Pressure Line: This dynamic oscillator maps the ebb and flow of market conviction. A rising line indicates that aggressive participants are entering the market, providing the "fuel" needed for a sustained trend.
- Peak Detection: When the line reaches extreme upper levels, it suggests that the current move has reached peak intensity. For a trend follower, this is a signal to tighten stop-losses as the market enters a potential distribution phase.
- The Zero-Bound Logic: While the line moves fluidly, its position relative to its previous lows provides a benchmark for market health. A "higher low" on the BSP line while price is consolidating is a powerful lead-indicator of an upcoming bullish breakout.
Strategic Advantages of Pressure-Based Trading
The BSP Indicator is an essential filter for any technical strategy, offering several key professional advantages:
- Spotting Institutional Accumulation: Institutions don't enter the market all at once; they build positions over time. The BSP Indicator picks up on this increased activity before the major price breakout occurs, giving retail traders a rare "early warning" system.
- Divergence Mastery: One of the most reliable signals in Forex is the divergence between price and pressure. If AUD/CAD hits a new high but the BSP Indicator shows a lower peak, the "Buying Pressure" is failing, and a short-sell opportunity is likely forming.
- Confirming Breakouts: Trading breakouts is notoriously difficult due to "fakeouts." The BSP Indicator acts as a final gatekeeper; you only take the trade if the breakout is accompanied by a sharp spike in pressure.
- Optimized for M15 Scalping: On the M15 timeframe, market noise can be overwhelming. The BSP Indicator smooths out these minor fluctuations, allowing scalpers to focus on moves that have actual institutional weight behind them.
Conclusion
The BSP Indicator for MT4 is more than just an oscillator; it is a window into the market's collective conviction. By focusing on Buying and Selling Pressure rather than just price wicks, it provides a more stable and objective framework for making trading decisions. Elevate your technical analysis today and start trading with the confidence that comes from knowing exactly who is in control of the market.
2 Downloads
Last Update:
Apr 16, 2026 01:29 AM
Published:
Feb 13, 2026 20:31 PM
Category: