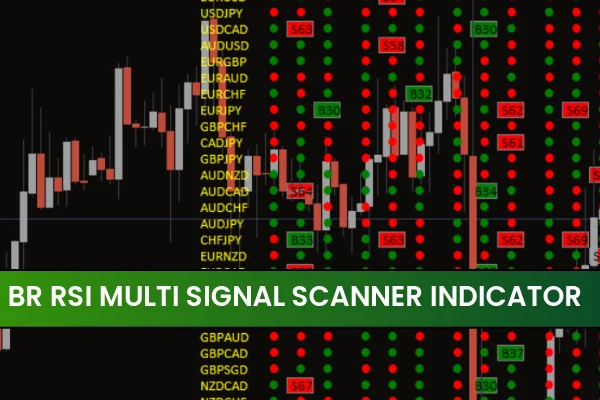
The Br RSI Multi Signal Scanner indicator for MT4 is a powerful forex trading tool designed to identify BUY and SELL opportunities using the Relative Strength Index (RSI) across multiple timeframes. This multi-timeframe scanner helps traders understand market momentum, overbought/oversold levels, and overall sentiment, making it especially valuable for both beginner and advanced traders. By visualizing RSI signals from higher and lower timeframes in one compact window, the indicator simplifies market analysis and helps traders make more informed trading decisions.
What Is the Br RSI Multi Signal Scanner Indicator?
The Br RSI Multi Signal Scanner indicator is a technical trading tool that automatically scans selected currency pairs and displays market conditions as BULLISH or BEARISH. Instead of manually flipping through different charts, traders can instantly read RSI signals from multiple timeframes inside a single dashboard.
The indicator uses color-coded visual signals:
GREEN dots → Bullish RSI conditions (BUY signal)
RED dots → Bearish RSI conditions (SELL signal)
This helps traders quickly spot trend direction, momentum, and potential reversal points.
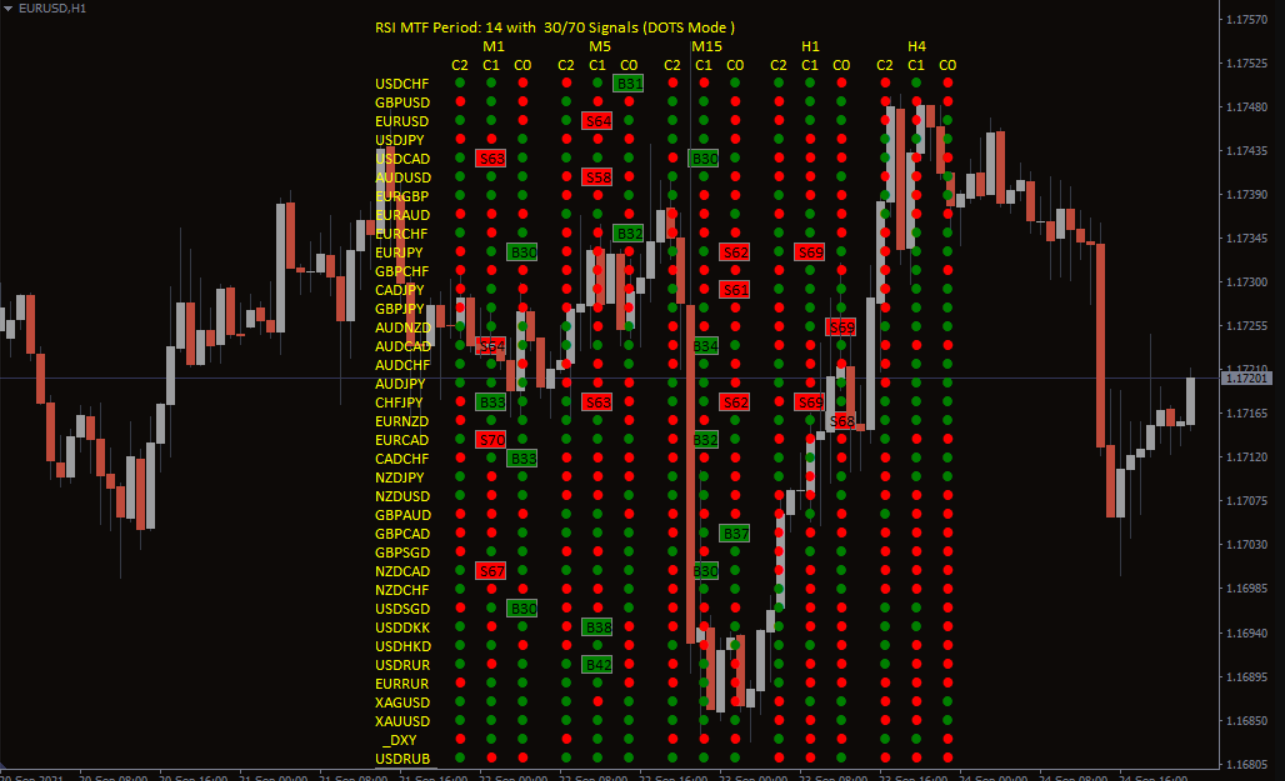
How the Multi-Timeframe RSI Signal Scanner Works
The indicator reads the RSI values of the last three candles for every timeframe you select. These signals are then displayed in an organized scanner format, allowing for a precise top-down analysis.
Multi-Timeframe Trading Logic
The strength of this indicator lies in its ability to show RSI patterns across M1, M5, M15, H1, H4, Daily, and other timeframes simultaneously. This allows traders to align lower timeframe entries with higher timeframe trends—a classic professional trading approach.
Buy/Sell Conditions
A BUY setup forms when the higher timeframe shows a bullish (GREEN) RSI signal. Traders should only enter BUY positions when lower timeframes confirm the same direction.
A SELL setup forms when the higher timeframe displays a bearish (RED) RSI signal. Lower timeframe SELL confirmations provide ideal entry points.
This ensures traders avoid counter-trend trades and remain in harmony with the market’s overall direction.
Best Trading Strategy Using Br RSI Multi Signal Scanner
Step 1 – Start With the Daily Timeframe
Begin your analysis by checking the Daily RSI signal.
If it shows RED, the market is bearish.
If it shows GREEN, the market is bullish.
This determines your trading bias for the day.
Step 2 – Look for Alignment on Lower Timeframes
Move down to H4, H1, M30, or M15 to find matching signals.
For BUY trades → Wait for a GREEN sequence on lower timeframes.
For SELL trades → Wait for a RED sequence.
Step 3 – Enter When Signals Align
When both higher and lower timeframes agree, this indicates momentum and Trend Strength. These are the safest entry points.
Step 4 – Exit at Opposite Signals
The indicator also helps with exit timing.
Exit BUY trades when bearish (RED) dots appear.
Exit SELL trades when bullish (GREEN) dots appear.
This approach protects profits and prevents early exits.
Why Traders Prefer This RSI Scanner
User-friendly display with numeric or dot-style signals
Fast, automated scanner covering multiple pairs
Great for beginners who struggle with multi-timeframe analysis
Useful for advanced traders combining RSI with trend strategies
Completely free to download and install
Enhances accuracy by filtering out trades that go against the main trend
Conclusion
The Br RSI Multi Signal Scanner Indicator for MT4 is an excellent tool for traders who rely on RSI, trend confirmation, and top-down analysis. Its clear BUY and SELL signals make forex trading more structured and easier to manage, regardless of experience level. For anyone seeking consistent and visually simple RSI-based confirmation, this scanner is a must-have.
For more premium and free MT4/MT5 indicators, visit IndicatorForest.com and explore dozens of professional trading tools.
FAQ
1 Download
Published:
Nov 21, 2025 08:35 AM
Category: