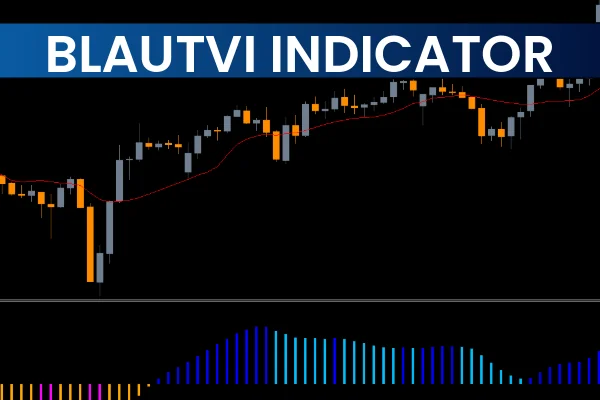
The ADXVMA Histogram Oscillator is a powerful combination of the Average Directional Index (ADX) and the Variable Moving Average (VMA). By merging the ADX, which measures Trend Strength, with the VMA, which identifies trend direction, this indicator offers traders critical insights into the market.
Designed for MT5, the ADXVMA Histogram Oscillator functions as a leading indicator, trend direction tool, and trend strength analyzer, making it suitable for traders of all levels. It works across various instruments, including forex, stocks, indices, metals, and commodities, and is effective on any timeframe.
How the ADXVMA Histogram Oscillator Works
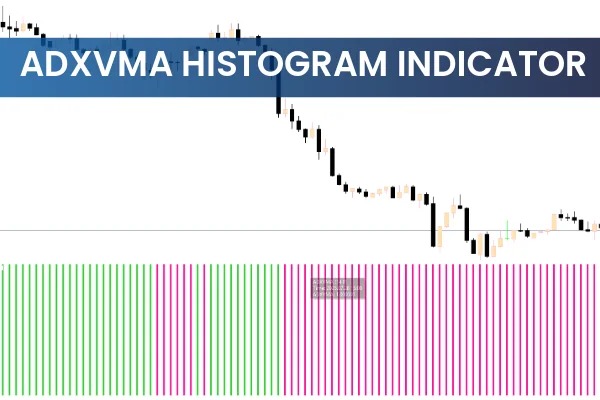
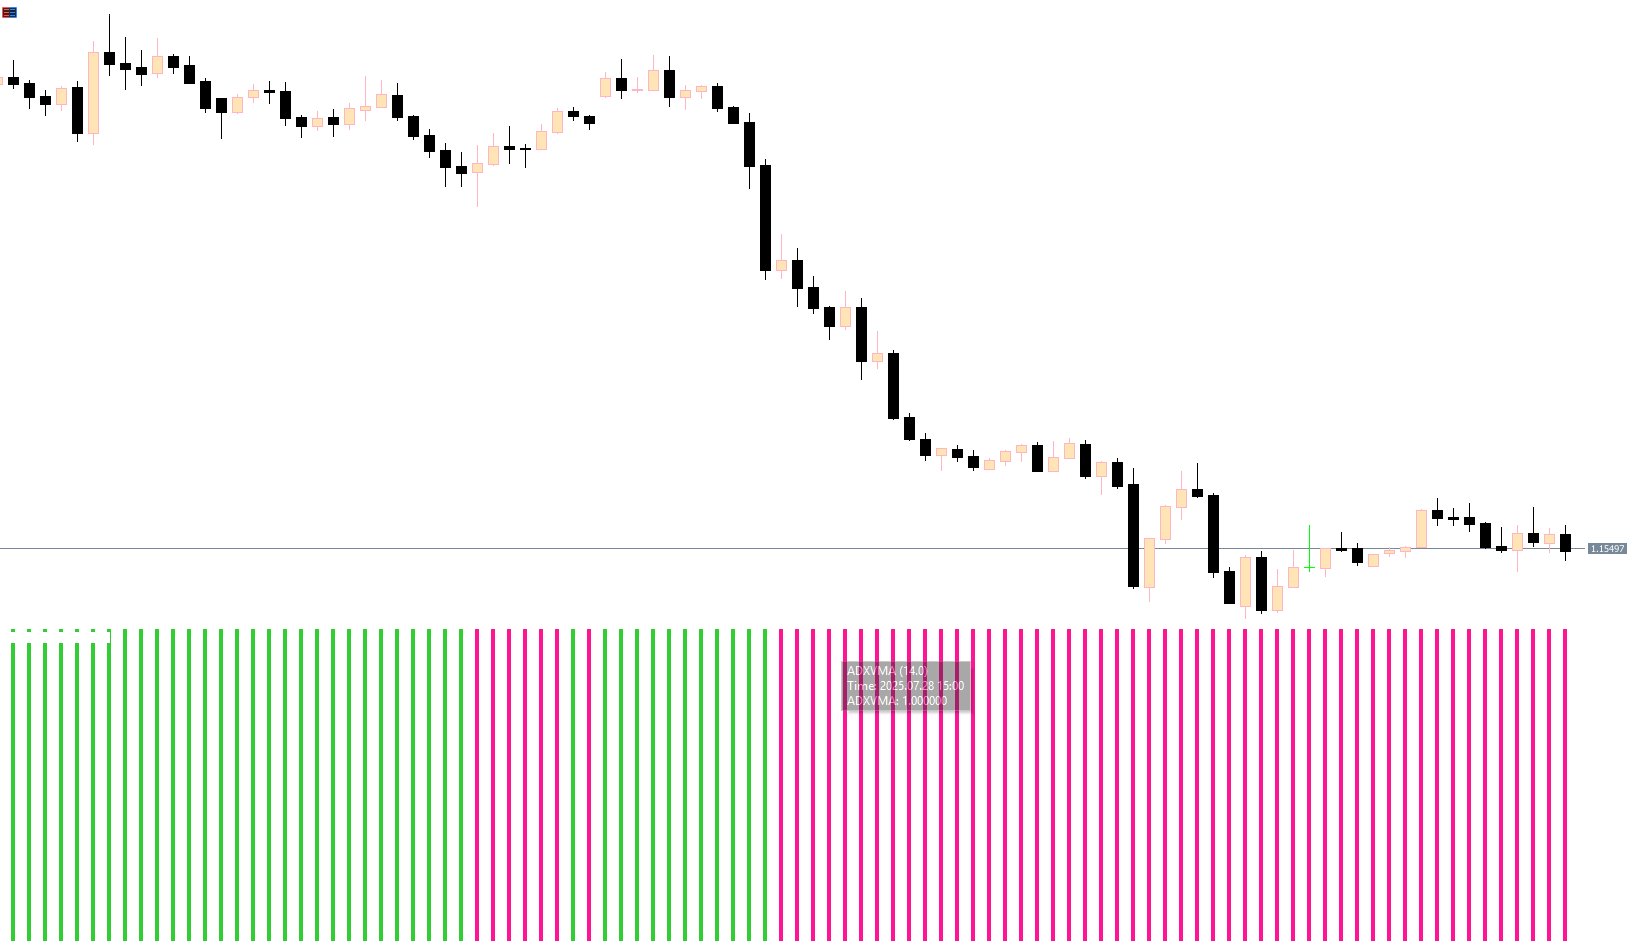
The indicator replaces the traditional D+ and D- lines with a histogram, allowing traders to visualize the difference between upward and downward movements.
GREEN histogram bars – Indicate an uptrend; BUY opportunities.
RED histogram bars – Indicate a downtrend; SELL opportunities.
Traders can open positions as soon as the histogram changes color and exit when it signals the opposite trend. For optimal performance, the ADX line should be observed to confirm trend strength and identify early exit points.
Trading Signals Using ADXVMA Histogram Oscillator
BUY Signal: Histogram turns GREEN; trend is upward.
SELL Signal: Histogram turns RED; trend is downward.
Trend Strength: Use the ADX line to gauge momentum and decide early exits.
Divergence: The oscillator may indicate early reversal points by comparing Price Action with histogram behavior.
This combination allows both novice and advanced traders to benefit:
New traders – Can easily identify trend direction and strength.
Advanced traders – Can integrate with other indicators for advanced technical strategies.
Advantages of the ADXVMA Histogram Oscillator
Trend Direction & Strength – Combines ADX and VMA for complete trend analysis.
Multi-Instrument Use – Forex, stocks, metals, indices, and commodities.
Multi-Timeframe Trading – Supports short-term and long-term strategies.
Visual Signals – Easy-to-read GREEN and RED histogram bars.
Leading Indicator Capabilities – Detects divergences for early entry and exit points.
Best Practices for Trading
Always confirm signals with the ADX line to evaluate trend strength.
Use multi-timeframe analysis (MTF) to enhance trading accuracy.
Combine with other technical indicators, such as RSI or moving averages, to reduce false signals.
Consider risk management tools like stop-loss and take-profit orders for consistent performance.
Conclusion
The ADXVMA Histogram Oscillator MT5 is a versatile and reliable trading tool for analyzing trend direction, strength, and potential reversals. By combining ADX and VMA, traders can make informed BUY and SELL decisions across multiple instruments and timeframes.
For effective trading, practice using the indicator on demo accounts and integrate it with other technical analysis tools.
Download the ADXVMA Histogram Oscillator for MT5 and enhance your trading strategy today.
FAQ
1 Download
Published:
Nov 26, 2025 01:14 AM
Category: