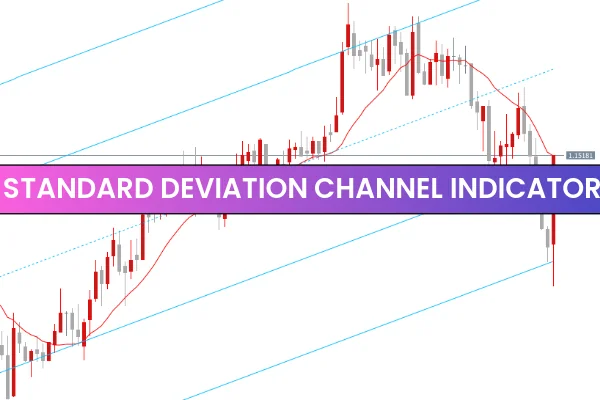
The Standard Deviation Channel Indicator for MT5 is a powerful tool designed to automatically plot dynamic trading channels using the mathematical standard deviation of price. These channels act as reliable Support And Resistance levels, helping forex traders identify BUY, SELL, STOP LOSS, and TAKE PROFIT levels with precision. Whether you are a beginner or an advanced trader, the indicator makes it easy to evaluate bullish and bearish market conditions in real time.
By displaying inside and outside channel lines, the indicator provides structural guidance across all intraday timeframes, daily charts, and even long-term trading. With its simple installation and free availability, the Standard Deviation Channel Indicator for MT5 has become a favorite among traders looking for price-action confirmation tools.
Understanding How the Standard Deviation Channel Indicator Works
Dynamic Support and Resistance Zones
The indicator plots three essential lines:
Outer Channel Lines: Strong support and resistance
Inner Channel Lines: Moderate support and resistance
Midline (Center Line): Trend bias line
When the price approaches the upper or lower channel, traders can anticipate potential reversals or breakout opportunities. This behavior mirrors traditional price-action concepts but with mathematically enhanced accuracy.
Bullish and Bearish Confirmation
A key benefit of the Standard Deviation Channel Indicator for MT5 is its ability to show trend direction in a visual and simplified manner:
BULLISH trend: Price rises above the midline
BEARISH trend: Price closes below the midline
This makes it easy to identify meaningful market momentum without relying on multiple indicators.
How to Trade Using the Standard Deviation Channel Indicator for MT5
Buy Signal Strategy
A BUY setup is formed when:
Price bounces upward from the inner or outer lower channel.
Price crosses above the midline, confirming bullish sentiment.
Take Profit is set at the upper channel.
Stop-Loss is placed near the lower channel to reduce risk.
Aggressive traders may open BUY positions immediately when price touches the outer lower channel, targeting the opposite upper boundary.
Sell Signal Strategy
A SELL setup forms when:
Price rejects the inner or outer upper channel.
Price crosses below the midline, confirming bearish direction.
Take Profit is targeted at the lower channel.
Stop-Loss is placed on or near the upper channel.
Technical traders often look for additional confirmation through Market Structure, volume behavior, and intraday S/R zones to enhance accuracy.
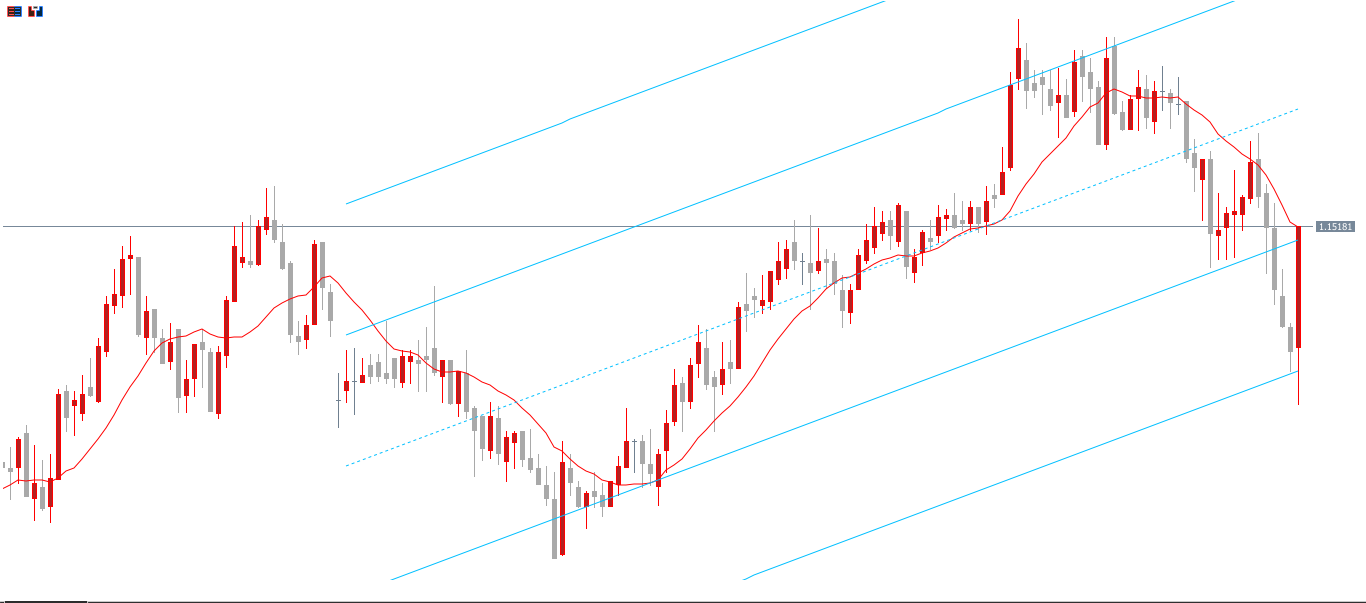
Practical Chart Example
In the USDCAD H1 example, the indicator displays:
MID channel line: Dotted Deep Sky Blue
Inside/Outside channel lines: Solid Deep Sky Blue
As price interacts with these lines, traders can:
Buy from support zones
Sell from resistance zones
Confirm direction using midline crossings
This structured approach supports consistent intra-day and swing trading decisions.
Why Traders Prefer the Standard Deviation Channel Indicator for MT5
Automatically calculates support and resistance
Displays bullish/bearish trend direction
Works on ALL timeframes (M1–MN1)
Ideal for beginners and expert traders
Free and easy to install
Helps identify clean entry and exit levels
Mathematical accuracy reduces subjective analysis
To explore more free MT4 and MT5 trading tools, visit IndicatorForest.com.
Conclusion
The Standard Deviation Channel Indicator for MT5 is one of the most reliable tools for identifying market structure, support, resistance, and trend direction. By creating automated mathematical channels, traders can spot high-probability BUY and SELL zones with ease. Whether you trade intraday or long-term, this indicator simplifies technical analysis while maintaining accuracy. Download this indicator and many more premium tools at IndicatorForest.com.
FAQ
4 Downloads
Published:
Nov 24, 2025 03:08 AM
Category: