Master the Markets with the Trendlines Day Indicator
In the fast-paced world of day trading, the ability to identify market direction quickly and accurately is the difference between a winning streak and a draining account. For many traders, manual chart drawing is time-consuming and prone to human error. Enter the Trendlines Day indicator—a powerful tool designed to automate your technical analysis and sharpen your entries.
The Power of Automated Trend Analysis
Trendlines are the backbone of Price Action Trading. They connect significant highs and lows to reveal the underlying momentum of an asset. However, as the market fluctuates throughout the day, these levels constantly shift. Trendlines Day removes the guesswork by dynamically plotting critical Support And Resistance lines in real-time.
By using this indicator, you can:
- Identify Breakouts Early: See exactly when price penetrates a long-standing trend, signaling a potential shift in sentiment.
- Spot Reversal Patterns: Recognize wedges, channels, and triangles as they form, allowing you to prepare for high-probability setups.
- Eliminate Bias: Manual drawing often reflects what a trader wants to see. An automated algorithm provides an objective view of Market Structure.
Why Every Day Trader Needs This Tool
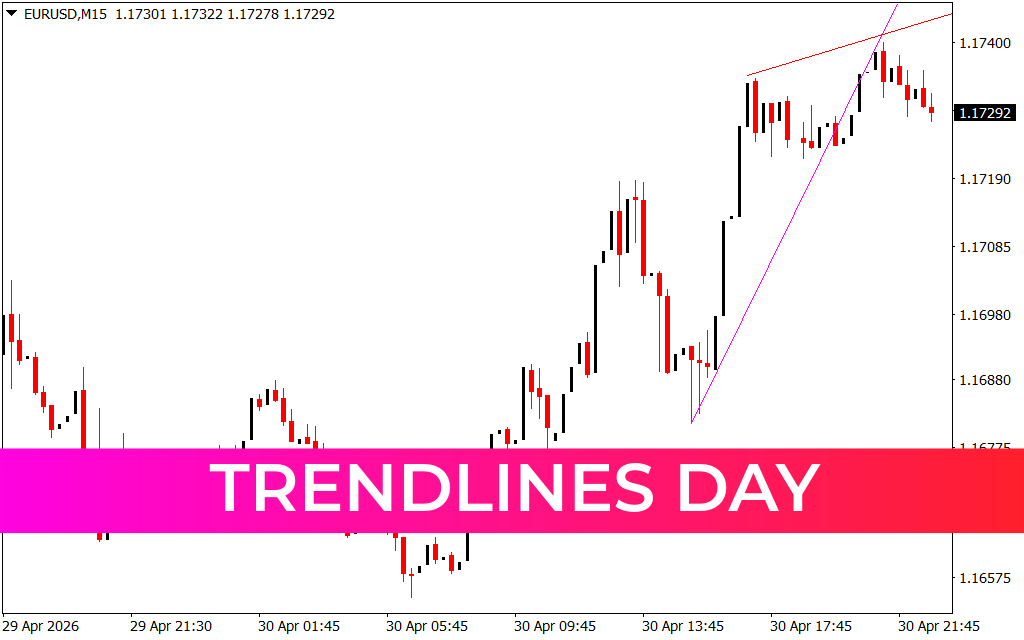
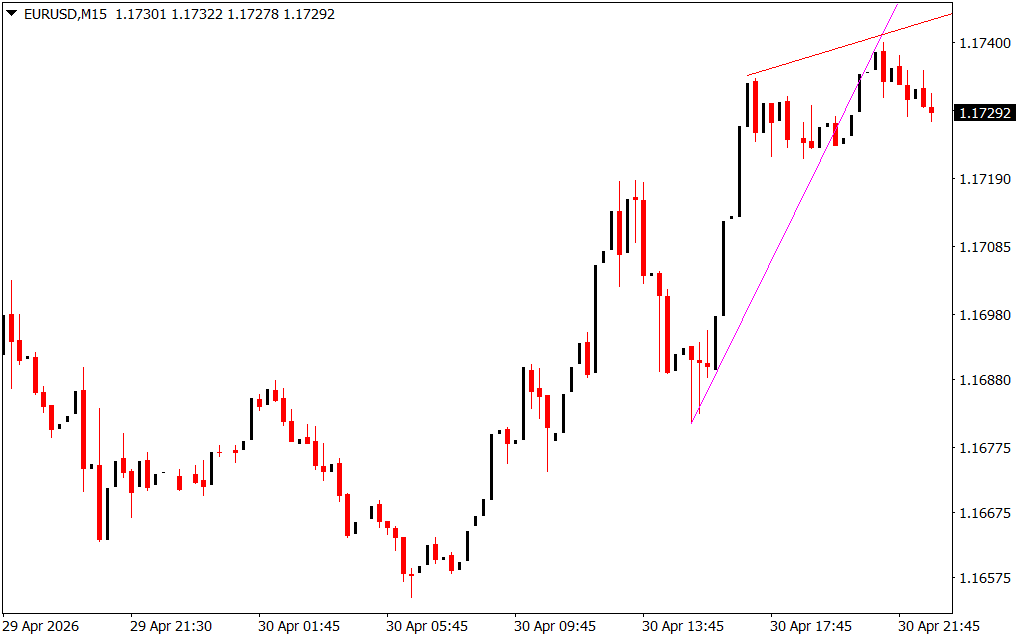
Day trading requires rapid decision-making. When you are looking at a 15-minute chart, like the EUR/USD pair, every candle counts. The Trendlines Day indicator highlights the "squeeze" between ascending support and descending resistance, pinpointing the exact moments of market compression.
When the price nears these automated lines, you are presented with two clear scenarios: a bounce or a break. Having these levels pre-calculated on your screen allows you to set precise stop-loss and take-profit orders, significantly improving your risk-to-reward ratio.
Integrating Trendlines into Your Strategy
While Trendlines Day is a robust standalone tool, it performs exceptionally well when paired with other technical indicators. For instance, if the indicator shows a price break above a descending trendline while the RSI (Relative Strength Index) shows bullish divergence, you have a high-confluence buy signal.
Furthermore, the indicator is versatile across various timeframes. Whether you are Scalping the 1-minute chart or swing trading the 4-hour, the logic remains consistent: follow the trend until it ends, and then trade the reversal.
Conclusion
Successful trading isn't about predicting the future; it's about reacting to the present with the best information available. The Trendlines Day indicator provides that clarity. By automating the most fundamental aspect of technical analysis, you free up your mental capital to focus on execution and psychology.
9 Downloads
Last Update:
May 01, 2026 02:06 AM
Published:
Jan 30, 2026 02:35 AM
Category: