TMaster Volumetric Momentum with the CHO Indicator for MT4
In the pursuit of professional-grade market analysis, Price Action is only one half of the equation. To truly understand the conviction behind a price move, a trader must analyze the volume flowing into the market. The CHO Indicator (Chaikin Oscillator) for MetaTrader 4 (MT4) is a definitive technical solution designed to bridge this gap. By combining price action with accumulation and distribution data, it provides a surgical view of market momentum that standard oscillators often miss.
The Science of the Chaikin Oscillator
Developed by Marc Chaikin, the CHO is essentially an "oscillator of an oscillator." It measures the momentum of the Accumulation/Distribution (A/D) line by calculating the difference between two exponential moving averages—typically a 3-period and a 10-period EMA. Because the A/D line focuses on where price closes relative to its high-low range for the period, the CHO effectively quantifies whether buyers or sellers are winning the "internal" battle of each candle.
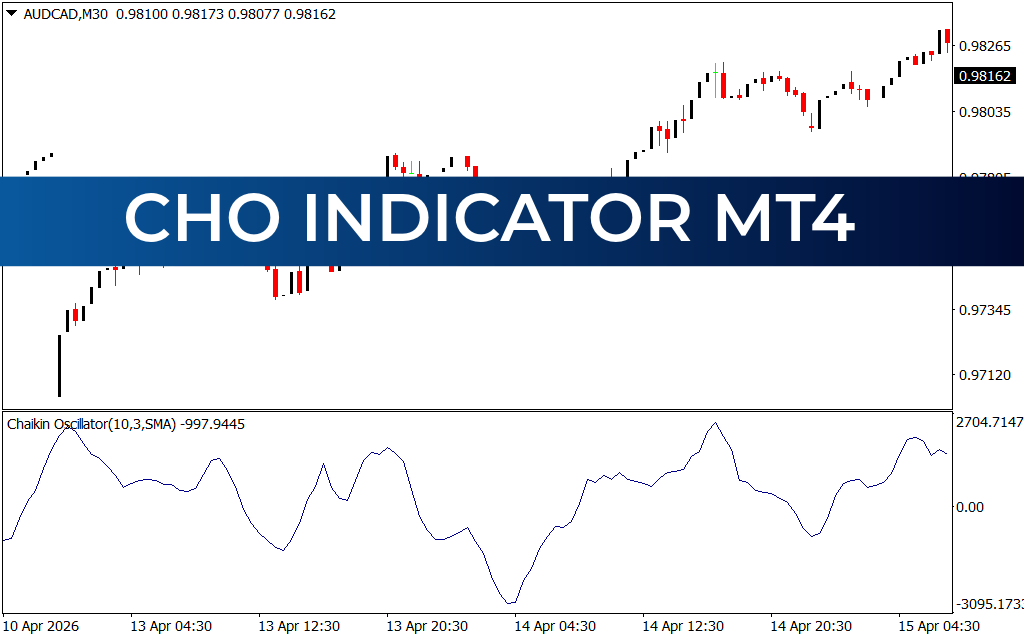
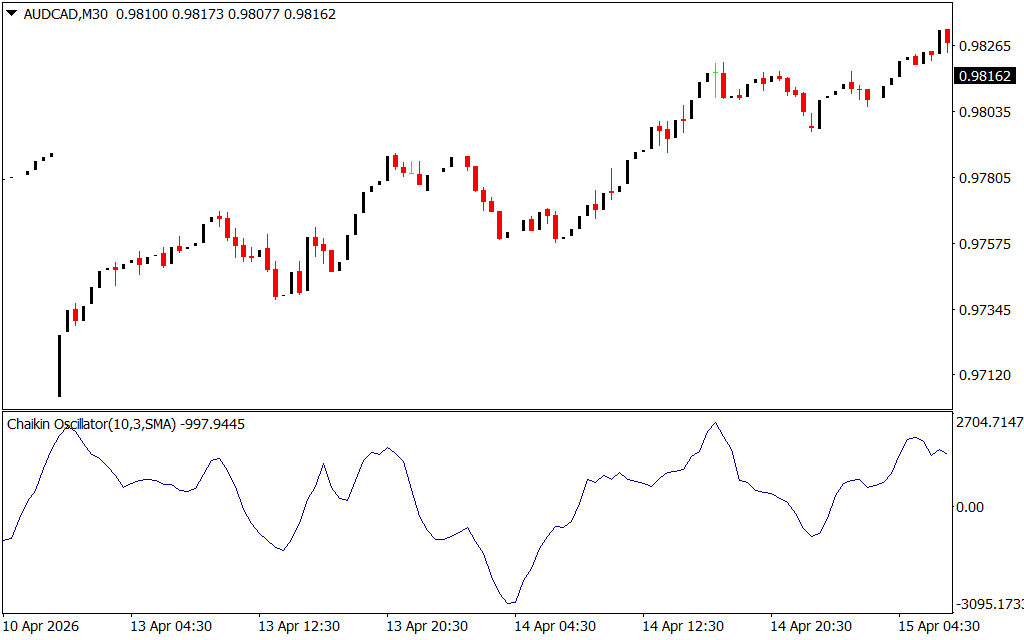
As demonstrated in technical analysis across liquid instruments like AUD/CAD on the M30 timeframe, the CHO system provides several definitive operational advantages:
- Identifying Institutional Conviction: When the CHO line moves aggressively into positive territory, it confirms that price increases are backed by strong accumulation (buying pressure). Conversely, a drop into negative territory suggests that institutional distribution (selling pressure) is driving the market lower.
- Precision Zero-Line Crossovers: The zero-line acts as the point of equilibrium. As seen on recent M30 charts, a crossover from negative to positive provides a high-probability signal that momentum has shifted in favor of the bulls, often preceding a significant price expansion.
- Surgical Divergence Detection: The CHO is world-class at spotting trend exhaustion. If price makes a new high but the CHO produces a lower peak, it signals "volume-price divergence." This provides a grounded, professional warning that the current trend lacks the participation necessary to continue, allowing for early exits.
- Filtering False Breakouts: During consolidation phases, the CHO remains tightly coiled around the zero-axis. This visual "quiet zone" helps traders avoid entering during low-conviction ranging periods where price lacks a definitive volumetric bias.
Strategic Implementation for Systematic Success
The CHO Indicator is an essential asset for any trader who values a disciplined, volume-based approach to the financial markets.
- The Trend-Following Filter: Use the CHO to validate trendline breaks. If price breaks above a resistance level and the CHO simultaneously crosses above the zero-line, the confluence of price and volume creates a high-conviction trade setup.
- Scalping Intraday Rotations: On lower timeframes, monitor the CHO for rapid swings across the zero-line during the New York or London session opens. This identifies the "first move" of institutional volume.
- Cross-Timeframe Synergy: Align the CHO bias on the M30 with the H4. When both timeframes show synchronized accumulation, the probability of a successful, sustained move increases exponentially.
Conclusion
The CHO Indicator for MT4 is a definitive solution for traders who demand more than just lagging price signals. By bridging the gap between raw price action and volumetric momentum, it empowers you to navigate the financial markets with grounded, professional confidence. Elevate your technical analysis today and master the flow of the market with the CHO system.
1 Download
Last Update:
Apr 18, 2026 22:49 PM
Published:
Feb 04, 2026 13:42 PM
Category: