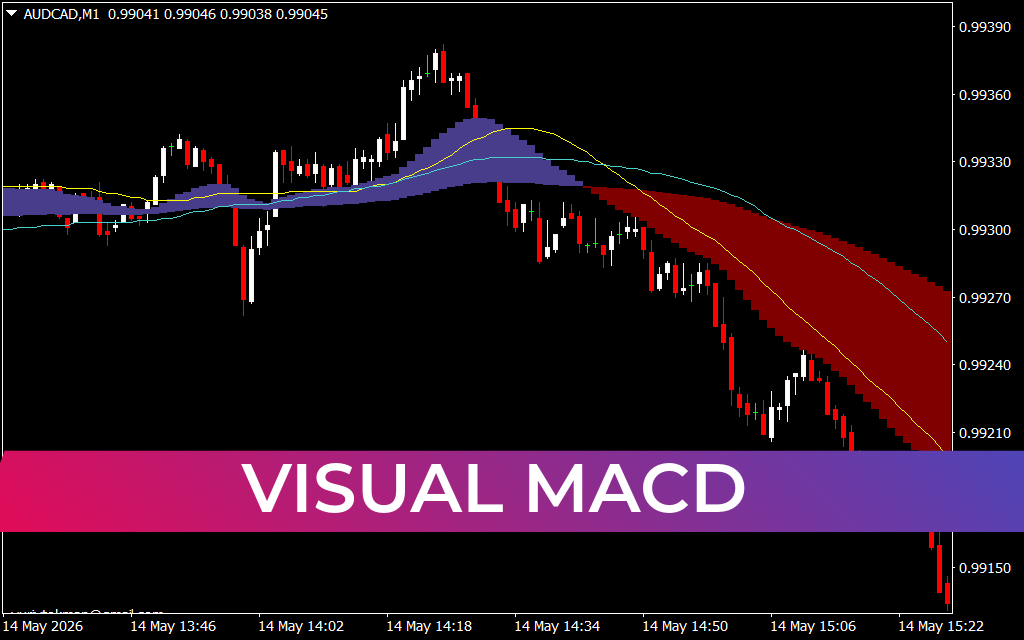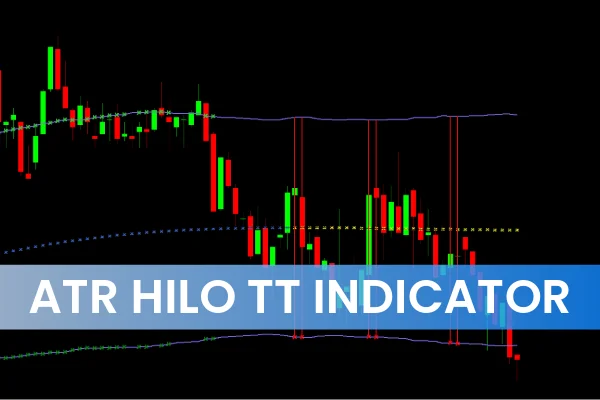
The ATR HiLo TT Indicator for MetaTrader 4 (MT4) is a dynamic trend channel indicator that leverages the Average True Range (ATR) to build flexible and adaptive price boundaries. These boundaries act as dynamic support and resistance zones, helping traders identify trend direction, volatility levels, and potential breakout opportunities in real time.
Unlike static price channels, the ATR HiLo TT dynamically adjusts to changing market conditions, expanding during high volatility and contracting during quieter periods. This allows traders to see where Price Action is most likely to reverse or continue — ideal for trend-following, breakout, or volatility-based strategies.
The indicator displays color-coded bands, a central moving trend line, and arrow signals that mark potential buy or sell setups. It works efficiently across multiple timeframes and any financial instrument, including forex, stocks, and commodities.
How the ATR HiLo TT Indicator Works
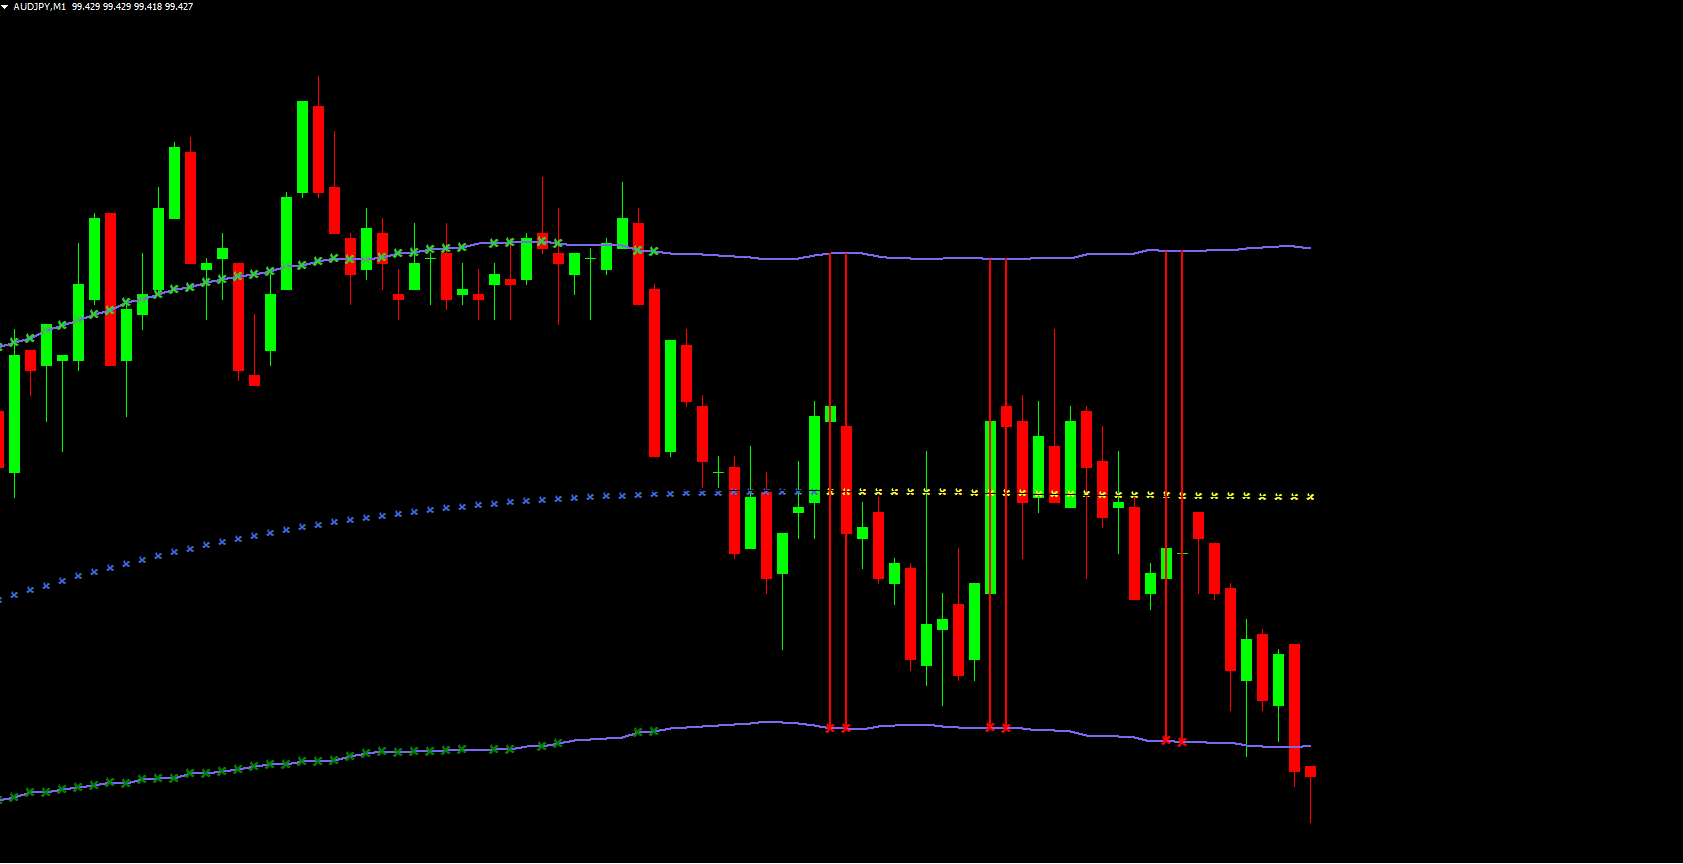
The ATR HiLo TT Indicator calculates price channels based on the ATR (Average True Range) — a popular volatility measure. The indicator then plots:
Upper and Lower Bands: Represent potential resistance and support zones.
Central Trend Line: Reflects the main market direction (bullish or bearish).
Directional Arrows: Signal possible entry points based on trend alignment and price interaction with the bands.
When volatility increases, the bands expand, signaling a dynamic market environment. Conversely, when volatility decreases, the bands contract, indicating consolidation or reduced momentum.
This adaptive behavior makes the ATR HiLo TT Indicator a responsive and low-lag trend detection tool, providing clearer insights into both momentum strength and potential reversals.
How to Trade Using the ATR HiLo TT Indicator for MT4
The ATR HiLo TT Indicator is primarily a trend-following and volatility-based channel system. Traders use it to identify entries based on price interactions with its dynamic boundaries.
Identifying Buy Signals
A green arrow appears when price touches or closes near the lower band while the channel slope is upward.
This indicates potential bullish momentum or a continuation of an existing uptrend.
Trade Tip: Enter a long position at the candle close and set a stop loss just below the lower band.
Identifying Sell Signals
A red arrow appears when price interacts with or pierces the upper band during a downward-sloping channel.
This suggests potential bearish continuation or a short-term correction in a downtrend.
Trade Tip: Enter short when the candle closes, placing a stop loss slightly above the upper band.
Confirming Trend Direction
The central line color and slope indicate the overall trend direction:
Upward slope + green tone: Bullish market condition.
Downward slope + red tone: Bearish market condition.
Avoid trading when the slope is flat — a sign of sideways or low-volatility markets.
Using the Indicator for Breakouts
A strong close beyond the outer bands combined with a steep channel slope can indicate high-momentum breakout opportunities.
Combine with a volume indicator or moving average crossover for confirmation.
ATR HiLo TT Indicator Settings
The indicator comes with several adjustable inputs to fine-tune its sensitivity and performance:
Setting
Description
Recommendation
ATR Period
Defines how many bars are used for volatility calculation.
Default: 14 (adjust for market conditions)
ATR Multiplier
Determines channel width. Higher values = wider channels.
1.5 to 3.0 for optimal balance
Arrow Alerts
Enables/disables buy/sell signal notifications.
ON for real-time alerts
Colors & Styles
Customize channel and arrow colors for better visibility.
Match chart theme for clarity
Best Practices for Trading with the ATR HiLo TT Indicator
Combine with Trend Filters: Use in conjunction with Moving Averages, RSI, or MACD to confirm trend direction.
Trade in Trending Conditions: Avoid trading in low-volatility or sideways markets where signals may be unreliable.
Adjust Timeframes: Works effectively from M30 to D1 charts for swing and position trading.
Use for Stop-Loss & Take-Profit Planning: The dynamic channel can help define protective stops and profit targets.
Confirm with Price Action: Watch for engulfing candles or trendline breaks around the bands before entering.
Benefits of the ATR HiLo TT Indicator
Dynamic ATR-Based Channels that adapt to market volatility.
Color-Coded Visuals to easily identify bullish or bearish zones.
Directional Arrows for clear entry signals and simplified decision-making.
Versatile Across Timeframes and Assets – works on forex, indices, commodities, and stocks.
Ideal for Trend Continuation and Breakout Trading.
Alert Notifications for instant buy/sell updates.
Conclusion
The ATR HiLo TT Indicator for MT4 is a powerful, adaptive trend-following tool that blends ATR-based volatility with visual clarity to guide traders through trending and volatile markets. Its color-coded channels and directional arrows make it beginner-friendly yet sophisticated enough for professional traders.
By dynamically adjusting to market conditions, it provides accurate trend and breakout insights while helping manage risk with smart, volatility-adjusted stop-loss placement.
Download the ATR HiLo TT Indicator for MT4 for free from IndicatorForest.com and enhance your trading precision with this powerful volatility-based system.
FAQ
11 Downloads
Published:
Nov 07, 2025 03:29 AM
Category: