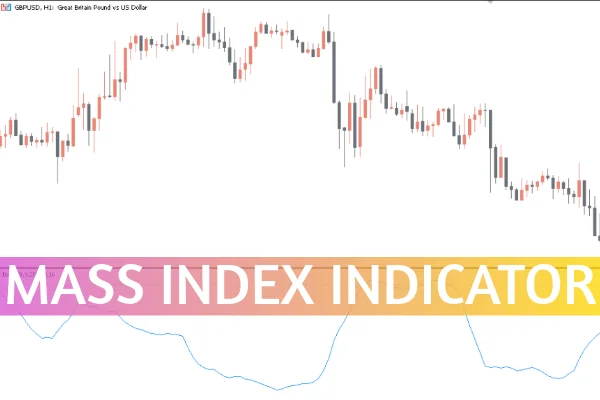
The Mass Index Indicator is a powerful technical analysis tool designed to help Forex traders identify potential trend reversals before they fully develop. In the fast-moving Forex market, trends are traders’ best friends—but even strong trends eventually reverse. Recognizing these turning points early can lead to highly profitable trades.

Developed by Donald Dorsey, the Mass Index measures volatility by analyzing price ranges rather than direction. Unlike many oscillators, it doesn’t signal overbought or oversold conditions; instead, it focuses on volatility expansion and contraction, signaling when a reversal may occur.
The Mass Index Indicator for MT5 calculates volatility using the High-Low range of price bars. When volatility expands significantly, it often precedes a major market move.
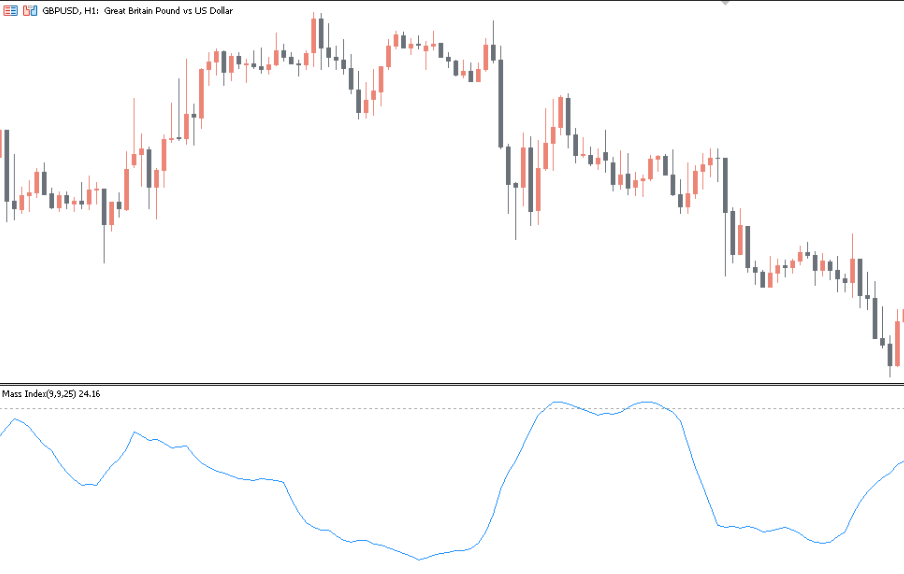
A key concept in this indicator is the “Reversal Bulge” (also known as a reversal swell). This occurs when the Mass Index rises above 27.0 and then falls below 26.5.
When this pattern appears, traders watch for confirmation from price action—such as a bullish engulfing, bearish engulfing, pin bar, or doji candle—to confirm that the trend reversal is real.
In simple terms:
Above 27.0 → potential reversal buildup
Falls below 26.5 → reversal confirmation signal
On a GBP/USD H1 chart, for example, the Mass Index often provides early warnings of trend reversals.
Let’s take a look at how traders apply it in practice:
Identify the Swell: Watch for the indicator line rising above 27.0 (signaling increasing volatility).
Wait for the Drop: When it falls below 26.5, this indicates a possible trend change.
Confirm with Price Action: Look for reversal patterns like bullish engulfing (for long trades) or bearish engulfing (for short trades).
Set Your Stop Loss: Place it near the swing low (for buys) or swing high (for sells).
Use a Trailing Stop: To lock in profits as the new trend develops.
For example, in late September 2022, the GBP/USD pair showed a bearish move with the Mass Index above 27. When it dropped below 26.5, and a bullish engulfing candle appeared, it signaled a strong buy opportunity—and the uptrend followed shortly after.
While the indicator works on any timeframe, many traders find it most reliable on higher timeframes—such as daily, weekly, or monthly charts. These longer periods filter out market noise and provide clearer reversal signals.
However, intraday traders can still use it effectively on 1-hour or 4-hour charts by combining it with other tools like:
Moving Average Crossovers
MACD (Moving Average Convergence Divergence)
Support and Resistance Zones
Early Detection of Trend Reversals: It helps traders spot potential reversals before they occur.
Volatility-Based Insights: Focuses on market volatility instead of price direction.
Flexible Application: Can be used across various instruments—Forex, stocks, or commodities.
Simple to Interpret: Only two main levels (26.5 and 27.0) are needed to generate signals.
Combine with Price Action: Always wait for a candlestick confirmation.
Avoid Low-Volatility Markets: The indicator performs better when volatility is moderate to high.
Use Higher Timeframes for Confirmation: Daily or weekly signals tend to be more reliable.
The Mass Index Indicator is one of the best technical tools for recognizing trend reversals in the Forex market. It’s simple, effective, and adaptable to multiple timeframes.
While it can be used independently, combining it with price action strategies, moving averages, or MACD provides stronger and more reliable trade setups.
Explore more powerful trading tools and free MT5 indicators at IndicatorForest.com to enhance your technical analysis today!
Published:
Oct 25, 2025 05:16 AM
Category: