The Easy Trend Visualizer Indicator is a powerful forex trading tool designed to simplify trend detection for traders of all skill levels. Built with three Average Directional Index (ADX) components, this indicator provides clear visual signals—arrows and horizontal bars—that help identify when a trend is beginning or ending.
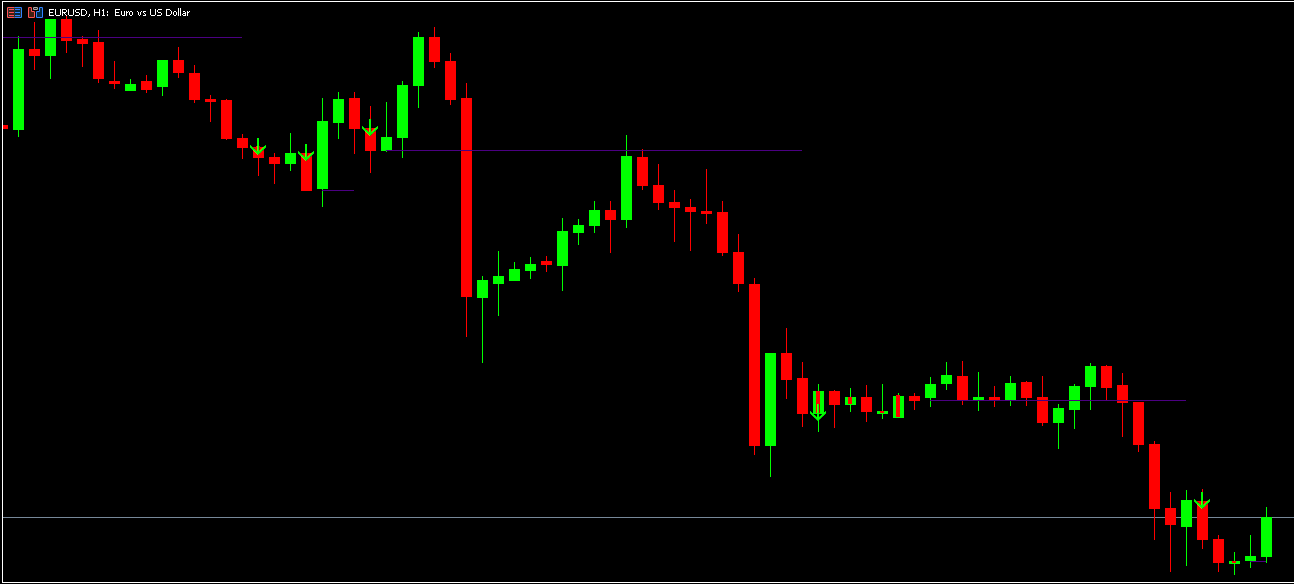
The arrows indicate the potential start of a new trend (buy or sell signal), while the horizontal bars suggest the end of a trend. This combination allows traders to make informed decisions on when to enter or exit positions, enhancing both accuracy and profitability.
How the Easy Trend Visualizer Indicator Works
At its core, the Easy Trend Visualizer uses ADX strength analysis to evaluate market momentum. When the ADX readings align across the three layers, it generates visual cues on the chart:
Green/Blue arrows → Indicate bullish trends and potential buy setups.
Red arrows → Signal bearish trends and potential sell opportunities.
Horizontal bars → Mark the weakening or possible reversal of a trend.
These visual aids simplify market analysis, allowing traders to interpret market trends without needing to study multiple indicators simultaneously.
Trading With the Easy Trend Visualizer Indicator
The Easy Trend Visualizer Indicator is best used in combination with Price Action or other technical tools like support/resistance zones and Candlestick Patterns.
For example, when applied to an AUDCHF currency pair, the indicator can highlight high-probability trade setups:
A buy signal appears when the price begins moving upward and the indicator shows a green arrow.
A sell signal can form after a double top pattern or a bearish engulfing candle, supported by a red arrow from the indicator.
By confirming signals through price action, traders can filter out false entries and significantly improve their win rate.
Benefits of Using the Easy Trend Visualizer Indicator
Clear Visual Cues
The Easy Trend Visualizer simplifies complex trend analysis into easy-to-read arrows and bars, making it accessible to beginners and advanced traders alike.
Works on Multiple Timeframes
Whether you’re a scalper, day trader, or swing trader, the indicator adapts seamlessly to different timeframes on MT5, ensuring consistent results.
ADX-Powered Accuracy
Because it relies on three ADX readings, the indicator minimizes false signals and delivers a more reliable Trend Confirmation than single-indicator systems.
Improves Entry and Exit Timing
Knowing when to enter or exit a trade is crucial in forex. The Easy Trend Visualizer helps identify both phases, improving overall trading discipline and profitability.
Best Practices for Maximum Efficiency
Use it alongside Support And Resistance levels for confirmation.
Combine it with a moving average or RSI indicator for additional Trend Strength validation.
Avoid trading against higher timeframe trends—always check the daily or H4 charts before taking entries on smaller timeframes.
For a better understanding of ADX and trend strength, visit this external reference: Investopedia – Average Directional Index (ADX).
Conclusion
The Easy Trend Visualizer Indicator for MT5 is an excellent tool for traders seeking a clear, structured view of market trends. Whether you’re looking to catch early reversals or confirm existing momentum, this indicator can drastically improve your decision-making process.
It’s free to download and easy to use, making it ideal for traders who want to trade smarter, not harder. Visit IndicatorForest.com today to download the Easy Trend Visualizer Indicator and explore a wide range of professional trading tools designed to elevate your strategy.
Published:
Nov 02, 2025 13:29 PM
Category: