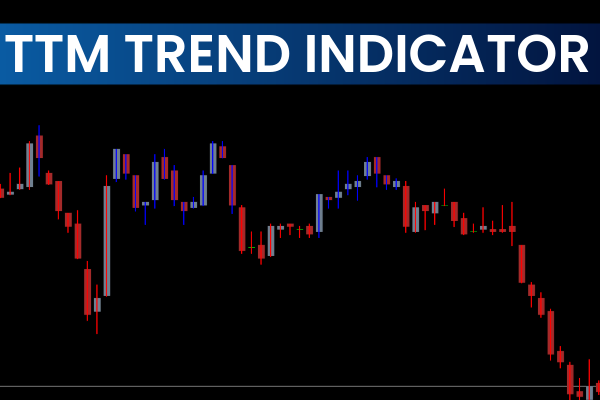
The TTM Trend Indicator for MT4 is a powerful trend-following tool designed to help forex traders quickly identify bullish and bearish market conditions. By changing candle colors based on price direction—BLUE for bullish trends and RED for bearish momentum—this indicator makes trend recognition simple and highly effective. Whether you're a beginner learning to follow market direction or an advanced trader executing systematic trend strategies, the TTM Trend Indicator offers clarity and confidence in your decision-making.
This indicator performs exceptionally well across all trading styles, including Scalping, day trading, swing trading, and long-term trading. It works on every timeframe, from M1 to monthly charts, making it a flexible and highly reliable technical tool.
How the TTM Trend Indicator for MT4 Works
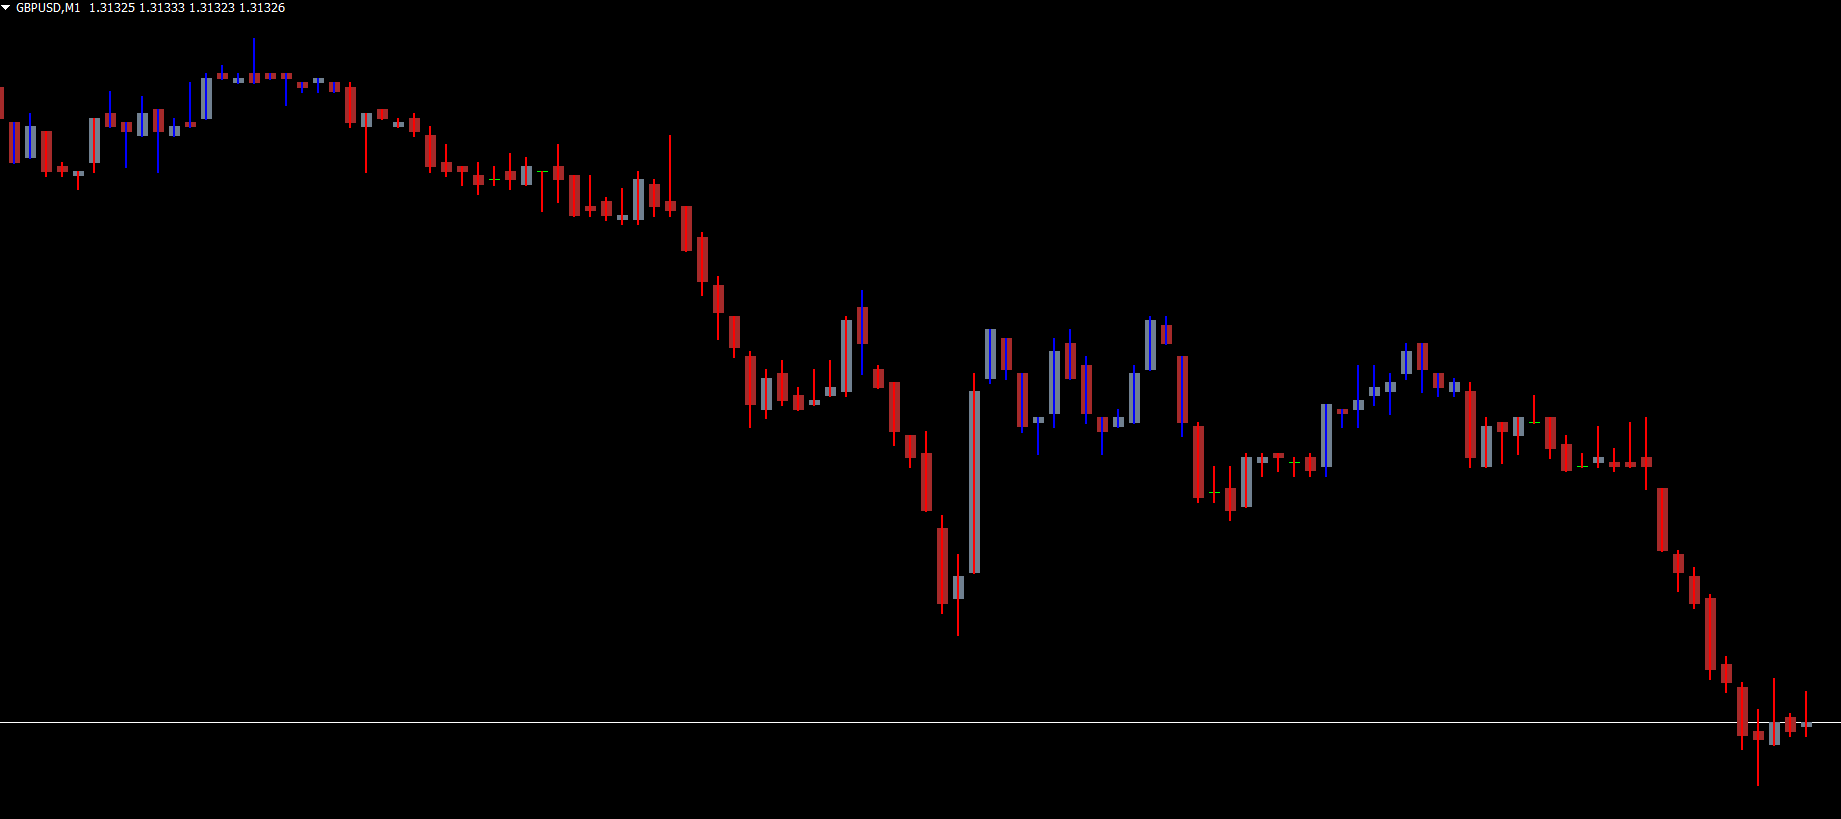
The TTM Trend Indicator uses price-based algorithms to determine market direction and colors each candlestick based on the current trend environment. This visual method eliminates confusion and helps traders avoid counter-trend traps.
BLUE candles = Bullish trend
RED candles = Bearish trend
These color changes make the overall market direction instantly visible, supporting better entries, exits, and trade management.
TTM Trend Indicator MT4 Trading Signals
The indicator is designed to provide straightforward buy and sell opportunities based on candle-color transitions. The following trading rules outline how to interpret signals effectively.
BUY Signal – When Red Turns to Blue
A bullish trend begins when the candle color shifts from RED to BLUE. This transition suggests that buying pressure is increasing and a potential uptrend is forming.
Entry Rules:
Enter a BUY position when the first BLUE candle appears.
Confirm momentum with Price Action patterns like bullish engulfing or higher-high formation.
Stop-Loss Placement:
Below the previous swing low, or
Exit early if a RED candle prints (opposite signal).
Take-Profit Strategy:
Hold until opposite signal (BLUE turns RED) for maximum trend capture.
Or exit at a favorable risk-to-reward level (e.g., 1:2 or 1:3).
SELL Signal – When Blue Turns to Red
A bearish trend begins when the candle color changes from BLUE to RED, indicating stronger selling momentum.
Entry Rules:
Enter a SELL position on the first RED candle.
Confirm using bearish price action such as pin bars, engulfing patterns, or lower-low formation.
Stop-Loss Placement:
Above the previous swing high, or
Exit on first BLUE candle (opposite signal).
Take-Profit Strategy:
Hold until the next BLUE signal for full trend coverage.
Or exit at a reasonable profit target using Market Structure.
Using the TTM Trend Indicator in Top-Down Analysis
The indicator is highly effective in multi-timeframe analysis:
Identify Primary Trend on Higher Timeframes
Use H4, Daily, or Weekly charts to determine the dominant market direction. Higher-timeframe trends are more stable and reduce false signals.
Time Entry on Lower Timeframes
Use M15, M30, or H1 charts to find precise entries that align with the main trend.
This combination greatly increases trade accuracy and reduces unnecessary losses.
Tips for Best Results with the TTM Trend Indicator
Combine it with price action, support/resistance, or moving averages for stronger confluence.
Avoid using it alone during extremely choppy or sideways markets.
Stick to higher timeframes (H1+) for cleaner and more reliable trend signals.
Conclusion
The TTM Trend Indicator for MT4 is an excellent tool for identifying market trends quickly and accurately. Its color-coded signals help both beginners and professionals execute more confident and profitable trades. By following trend direction and exiting strategically, traders can maximize gains and avoid entering against market momentum.
To download more premium trading indicators and tools, visit IndicatorForest.com, your trusted source for free and powerful MT4/MT5 resources.
FAQ
Published:
Nov 18, 2025 21:03 PM
Category: