The Overlay Chart Indicator MT4 is a simple yet powerful tool that allows traders to compare the Price Action of two forex pairs on a single chart. Instead of flipping between multiple charts or trying to analyze correlations separately, traders can visually overlay one currency pair over another. This indicator displays not only the price action but also the high, low, open, and close prices of the overlaid pair, making analysis clearer and more efficient.
Understanding the Overlay Chart Indicator MT4
Currency correlation plays an important role in forex trading. Some currency pairs move in the same direction due to economic relationships, while others move inversely. The Overlay Chart Indicator MT4 helps traders identify these positive or negative correlations by showing both price actions in one place.
Positive correlations occur when two currency pairs move in the same direction. For example, EUR/USD and GBP/USD often show strong positive correlation. Negative correlations occur when two pairs move in opposite directions, such as EUR/USD and USD/CHF. By overlaying price movements, traders can quickly spot whether the secondary pair confirms or contradicts the movement of the primary pair.
Although the indicator can be used on any timeframe, traders typically apply it on longer timeframes (H4, Daily, Weekly) to reduce noise and gain clearer insights into correlation behavior.
Overlay Chart Indicator Buy/Sell Signals
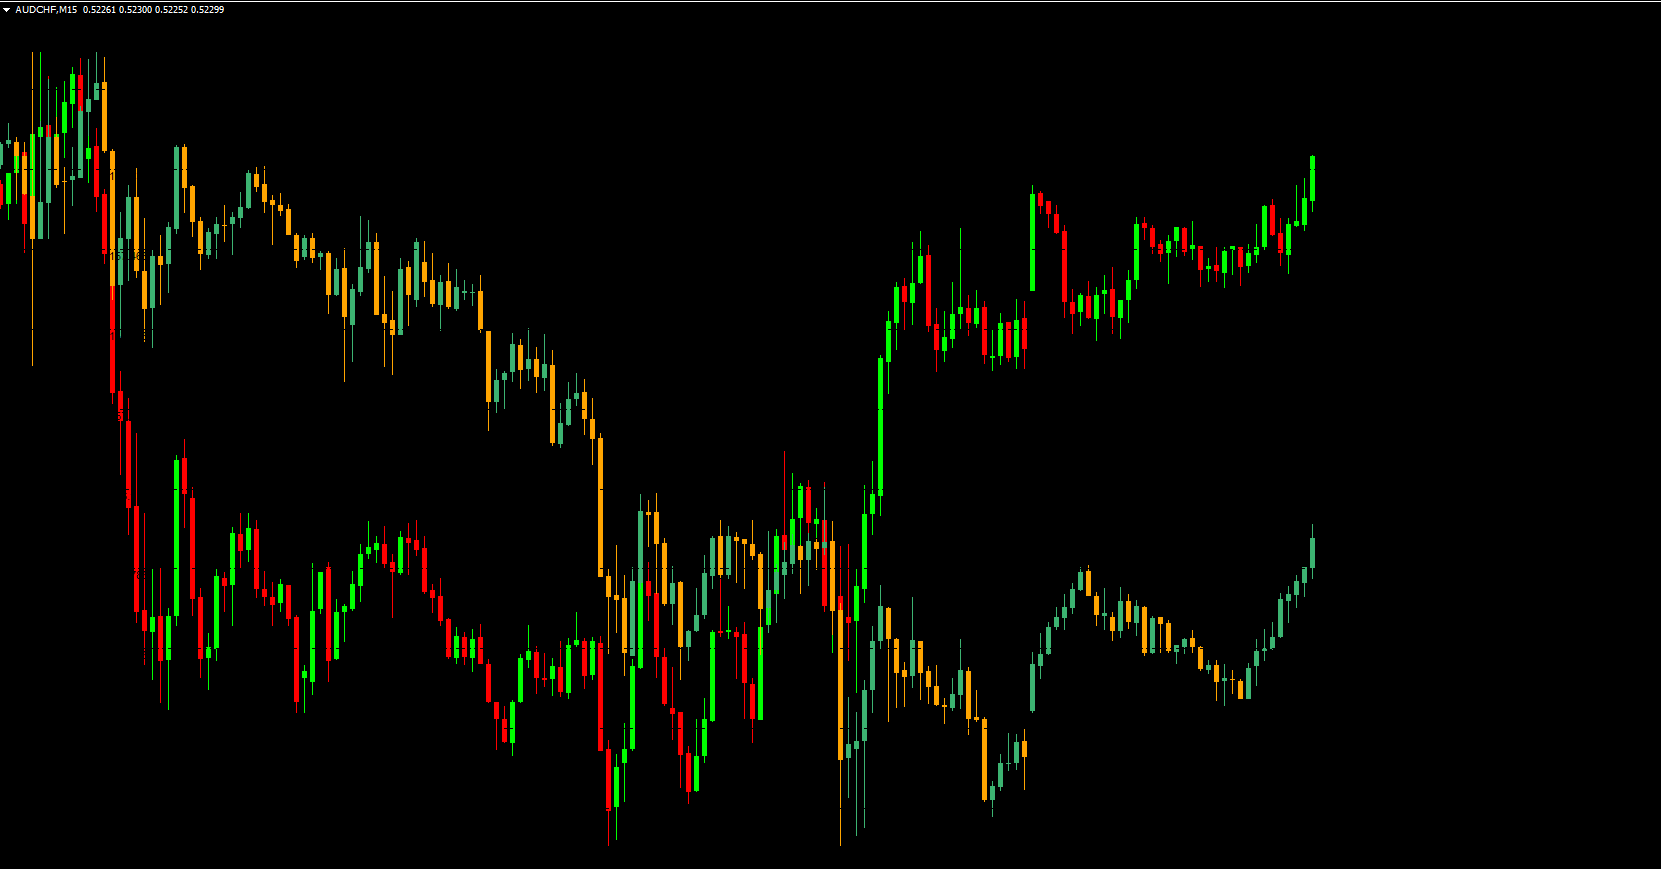
The Overlay Chart Indicator MT4 helps traders identify potential BUY and SELL signals through visual comparison. In the example of USD/CAD as the main pair and USD/JPY as the overlaid pair, the indicator uses green and orange bars to illustrate the trend direction of the overlaid pair:
Green bars: Bullish price action
Orange bars: Bearish price action
To interpret signals:
For the Overlaid Pair
Traders follow the color-coded bars indicating whether USD/JPY is currently bullish or bearish. These visual cues make it easy to assess short-term and medium-term momentum.
For the Primary Pair
Traders watch the actual price action of USD/CAD on the main chart. When both pairs move in the same direction (positive correlation), the movement of one pair can help confirm signals on the other. When the two pairs diverge (negative correlation), it may signal potential reversals, breakouts, or trading opportunities based on correlation imbalance.
Why Confirmation Tools Are Necessary
While the Overlay Chart Indicator MT4 is highly useful, it can be difficult to determine exact entry and exit points solely from the overlay. Therefore, traders often add confirmation indicators such as RSI, MACD, Stochastic Oscillator, or Moving Averages. These tools help validate signals and reduce the risk of false convergence or divergence.
What Is an Overlay in Technical Analysis?
An overlay occurs when additional price action or indicator output is drawn directly over the main price chart instead of appearing in a separate window. Overlay analysis helps traders compare two datasets visually and identify relationships between them.
Examples of overlays include:
Moving Averages
Bollinger Bands
Ichimoku Cloud
Price overlays such as the Overlay Chart Indicator MT4
Overlays differ from oscillators (like MACD or RSI), which appear below the chart. Overlay indicators provide structural insight into price movement without separating the visual analysis into multiple windows.
What Are Overlay Indicators?
Overlay indicators display one set of price data on top of another. When using the Overlay Chart Indicator, the second currency pair appears directly on the main chart, synchronized by time. This method allows traders to view correlation, divergence, trend strength, and Market Structure without switching between multiple charts.
Overlay indicators are especially useful for:
Correlation trading
Hedging strategies
Pair comparison
Market confirmation
spotting divergence between correlated instruments
Conclusion
The Overlay Chart Indicator MT4 is an effective tool that allows traders to visualize the price action of two forex pairs on a single chart. By comparing the overlaid pair with the primary pair, traders can make better-informed decisions based on correlation and trend behavior. Whether you want to identify confirmations, divergences, or opportunities across correlated markets, this indicator helps streamline your analysis. You can download this indicator for free at IndicatorForest.com and enhance your trading toolkit today.
FAQ
3 Downloads
Published:
Nov 24, 2025 02:58 AM
Category: