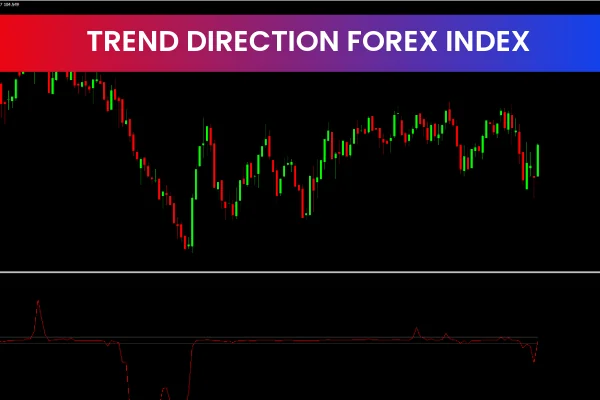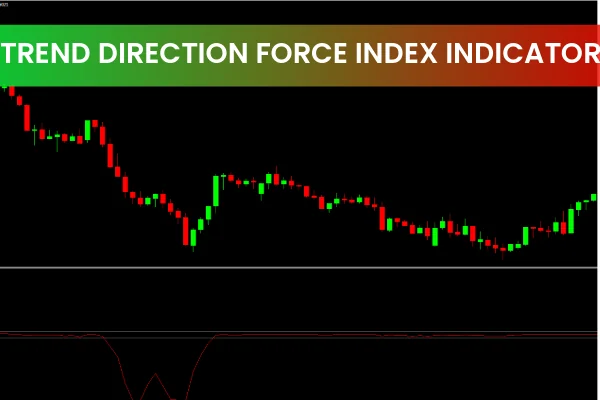
The Trend Direction Force Index is a powerful custom indicator for MetaTrader designed to measure price changes and the force driving an asset’s movement. Traders use it to detect trend direction, breakout opportunities, and early reversal zones. Because it oscillates between +1 and –1, the indicator clearly displays when the market is bullish, bearish, or moving sideways. The Trend Direction Force Index helps traders understand market momentum, making it a valuable tool for both beginners and experienced traders.
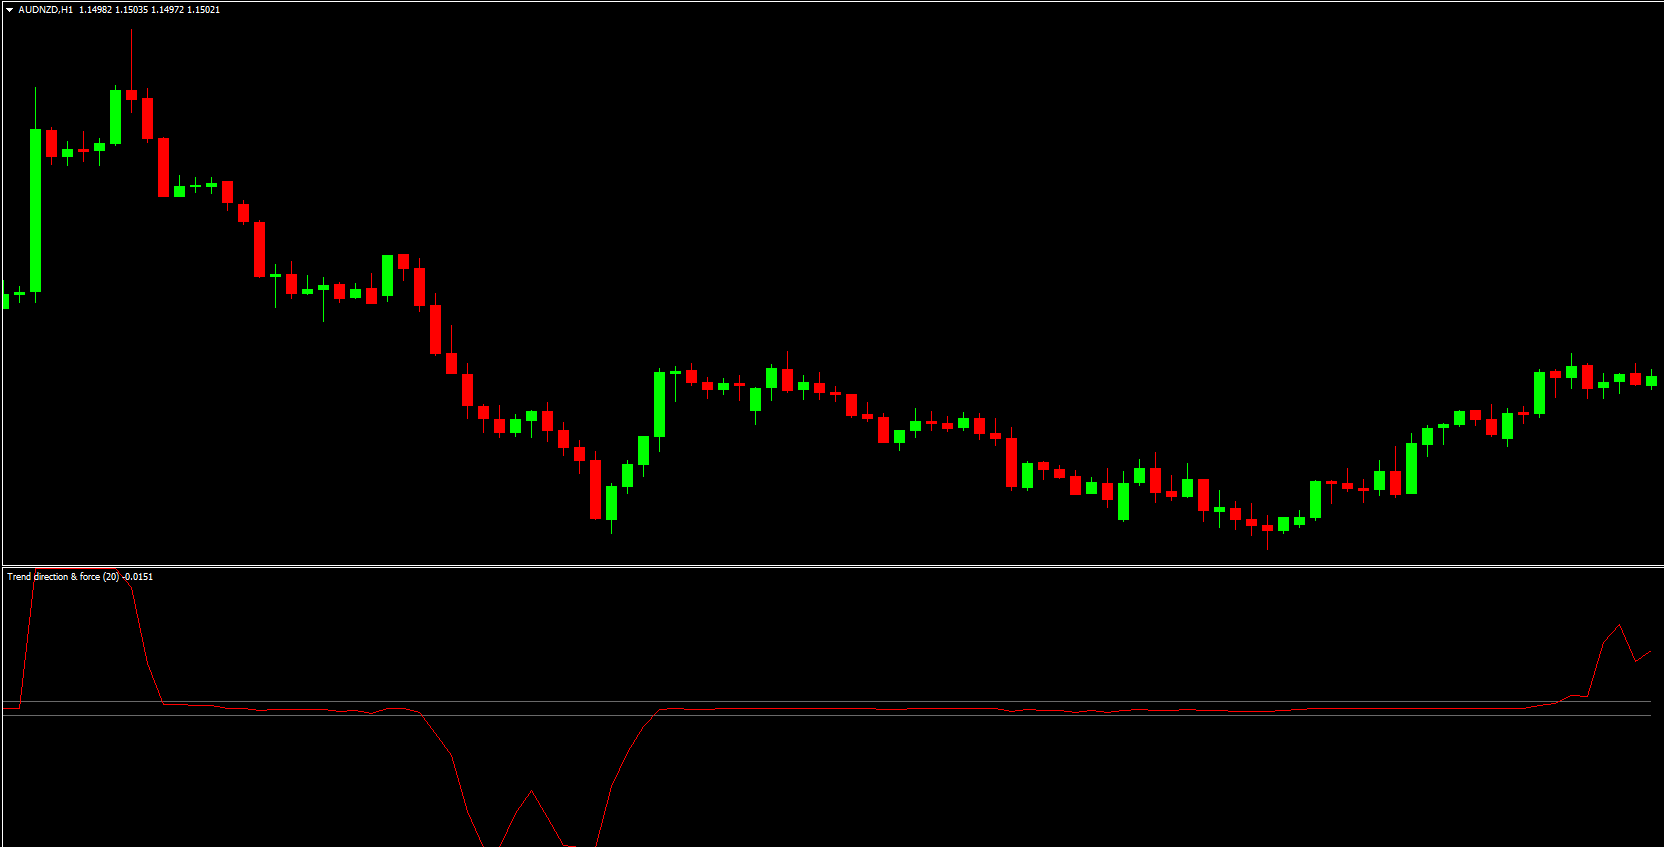
This indicator works on a separate oscillator window and shifts toward the positive region during bullish phases, while negative values reflect bearish conditions. When the line sits near the 0.00 level, the market is likely consolidating—a useful signal for identifying range-bound environments.
Why Traders Prefer the Trend Direction Force Index
Ideal for Multiple Trading Styles
Scalpers, day traders, intraday traders, and swing traders benefit from this indicator due to its clarity and responsiveness.
H4 timeframe: Best for day and intraday trading.
H4 and above: Recommended for swing trading and long-term trend analysis.
Enhances Accuracy When Combined With Other Tools
Although strong on its own, the Trend Direction Force Index performs best when paired with:
Price Action patterns
Support And Resistance levels
Moving averages
Breakout strategies and momentum indicators
Using it alongside other tools improves signal confirmation and reduces false entries.
How the Trend Direction Force Index Works
The indicator reads the force and direction behind price movements.
Above +0 level: Momentum is bullish
Below –0 level: Momentum is bearish
Near 0.00 zone: Market is ranging or indecisive
This structure allows traders to detect whether a trend is gaining or losing strength and when a breakout may occur.
How to Trade With the Trend Direction Force Index Indicator
BUY Setup (Bullish Strategy)
Wait for the indicator line to cross above the 0.00 level.
Confirm bullish Market Structure (e.g., higher lows, bullish engulfing candle).
Enter a BUY/LONG trade aligned with price momentum.
Consider exiting when the indicator weakens back toward the center level or when price action shows reversal signs.
SELL Setup (Bearish Strategy)
Wait for the indicator line to cross below the 0.00 level.
Confirm bearish price action (e.g., lower highs, bearish engulfing).
Enter a SELL/SHORT position.
Monitor for opposite signals or diminishing momentum as potential exit cues.
Tips for Better Accuracy
Avoid trading when the indicator hovers around the center level for extended periods.
Always confirm signals with candlestick analysis or trendlines.
Check multiple timeframes to validate long-term and short-term momentum.
Why the Trend Direction Force Index Is Effective
The indicator is highly effective because it helps traders identify:
Reversal zones
Consolidations
Breakout momentum
Its ability to detect short-term and long-term force behind price makes it useful across forex, indices, metals, and crypto markets.
Conclusion
The Trend Direction Force Index is one of the best tools for spotting market ranges, trend breakouts, and short-term momentum shifts. Whether you’re Scalping or swing trading, this indicator provides valuable insights into price force and directional strength.
Explore more trading tools and premium indicators at IndicatorForest.com.
FAQ
2 Downloads
Published:
Nov 22, 2025 13:49 PM
Category: