The Trend CCI Indicator for MT4 is a custom-built oscillating tool that combines the traditional Commodity Channel Index (CCI) with a momentum detector. This innovative integration provides traders with a dual function — measuring market momentum and determining the trend direction of any asset.

By offering both trend bias and reversal zones, the Trend CCI indicator simplifies technical analysis for traders of all levels — from beginners to advanced. You can instantly assess whether the market is trending bullish or bearish and gauge the strength of that movement at a glance.
How the Trend CCI Indicator Works
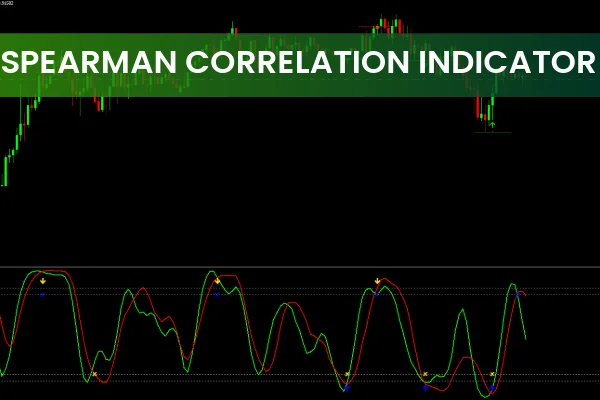
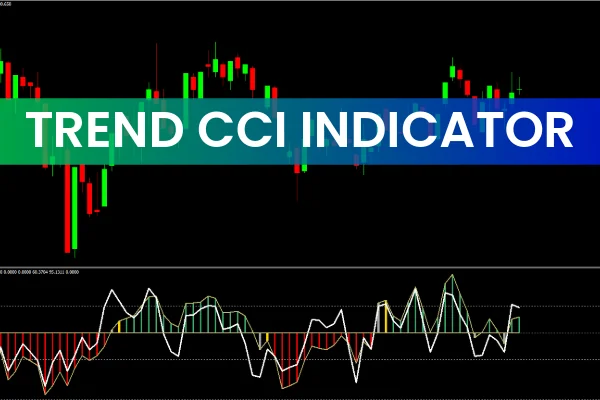
The Trend CCI Indicator for MT4 oscillates around the 0.00 level, which acts as the central trend line. Its movement provides clear visual cues:
When the CCI line is above 0.00, it signals a bullish bias.
When it moves below 0.00, it indicates a bearish bias.
The +250 and -250 levels are the overbought and oversold zones, respectively, where a price reversal is likely to occur.
Additionally, the histogram bars represent the momentum or strength of the price movement. Taller bars indicate stronger momentum, helping traders gauge whether the market has the power to continue in its current direction or if a reversal is imminent.
How to Trade with the Trend CCI Indicator
Using the Trend CCI Indicator for MT4 effectively requires understanding its signals and combining them with other analytical tools like Price Action, RSI, or moving averages for confirmation.
BUY Setup
Wait for the CCI line to reach or dip below the -250 (oversold) zone.
Watch for the line to cross above the 0.00 level, signaling bullish momentum.
Confirm with price action signals, such as bullish engulfing candles or a break of resistance.
Enter a BUY (long) position once momentum aligns with trend direction.
SELL Setup
Wait for the CCI line to rise to the +250 (overbought) zone.
Watch for a cross below the 0.00 level, indicating bearish pressure.
Confirm using bearish reversal patterns like shooting stars or bearish engulfing candles.
Enter a SELL (short) position as momentum turns downward.
The Trend CCI Indicator is flexible across different timeframes:
Scalping: Use on M30 or lower timeframes for quick trades.
Day/Intraday Trading: Ideal for H1–H4 charts.
Swing Trading: Use on Daily or higher timeframes for long-term analysis.
Benefits of the Trend CCI Indicator for MT4
Dual Functionality: Measures both market momentum and trend direction.
Clear Visuals: Histogram and CCI line make interpretation easy.
Multi-Strategy Use: Effective for scalping, intraday, and swing trading.
Universal Application: Suitable for all asset classes – forex, commodities, indices, and stocks.
User-Friendly Interface: Designed for both novice and experienced traders.
By combining it with other technical tools such as the MACD or Bollinger Bands, you can filter false signals and strengthen your overall trading strategy.
Pro Tips for Effective Trading
Avoid taking trades solely based on CCI crosses—always confirm with price action.
Higher timeframes often provide more reliable signals.
Use proper risk management with stop-loss levels beyond recent swing highs/lows.
Combine with trend-following indicators like Moving Averages for better entry timing.
Why Choose IndicatorForest.com
At IndicatorForest.com, we provide professional-grade MT4 indicators to help traders make better and more confident trading decisions. The Trend CCI Indicator for MT4 is available for free download, offering a dynamic and intuitive approach to understanding market momentum.
Visit our website to explore more custom MT4 indicators, expert trading tools, and guides designed to enhance your trading performance and profitability.
FAQ
1 Download
Published:
Nov 11, 2025 20:59 PM
Category: