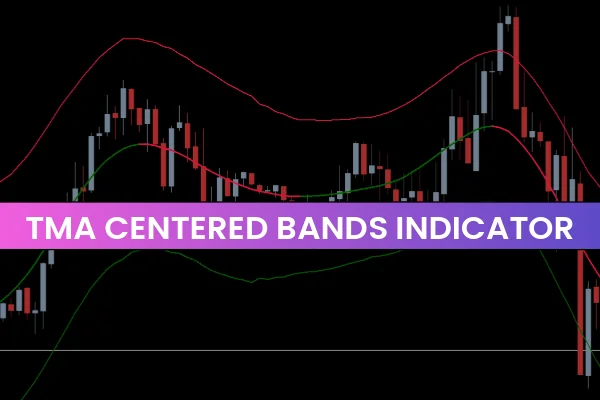
The TMA Centered Bands Indicator for MT4 is a powerful trend-following and reversal-spotting tool that uses triangular moving averages (TMA) to plot dynamic price bands. These bands help traders identify trend direction, key reversal zones, and high-probability entry and exit points. Its visual design—featuring red, green, and red-green bands—makes market sentiment easy to interpret, even for beginner traders.
This MT4 indicator adapts to price movement, allowing traders to detect overbought/oversold conditions, Trend Continuation, and reversal setups across any timeframe.
What Are TMA Centered Bands?
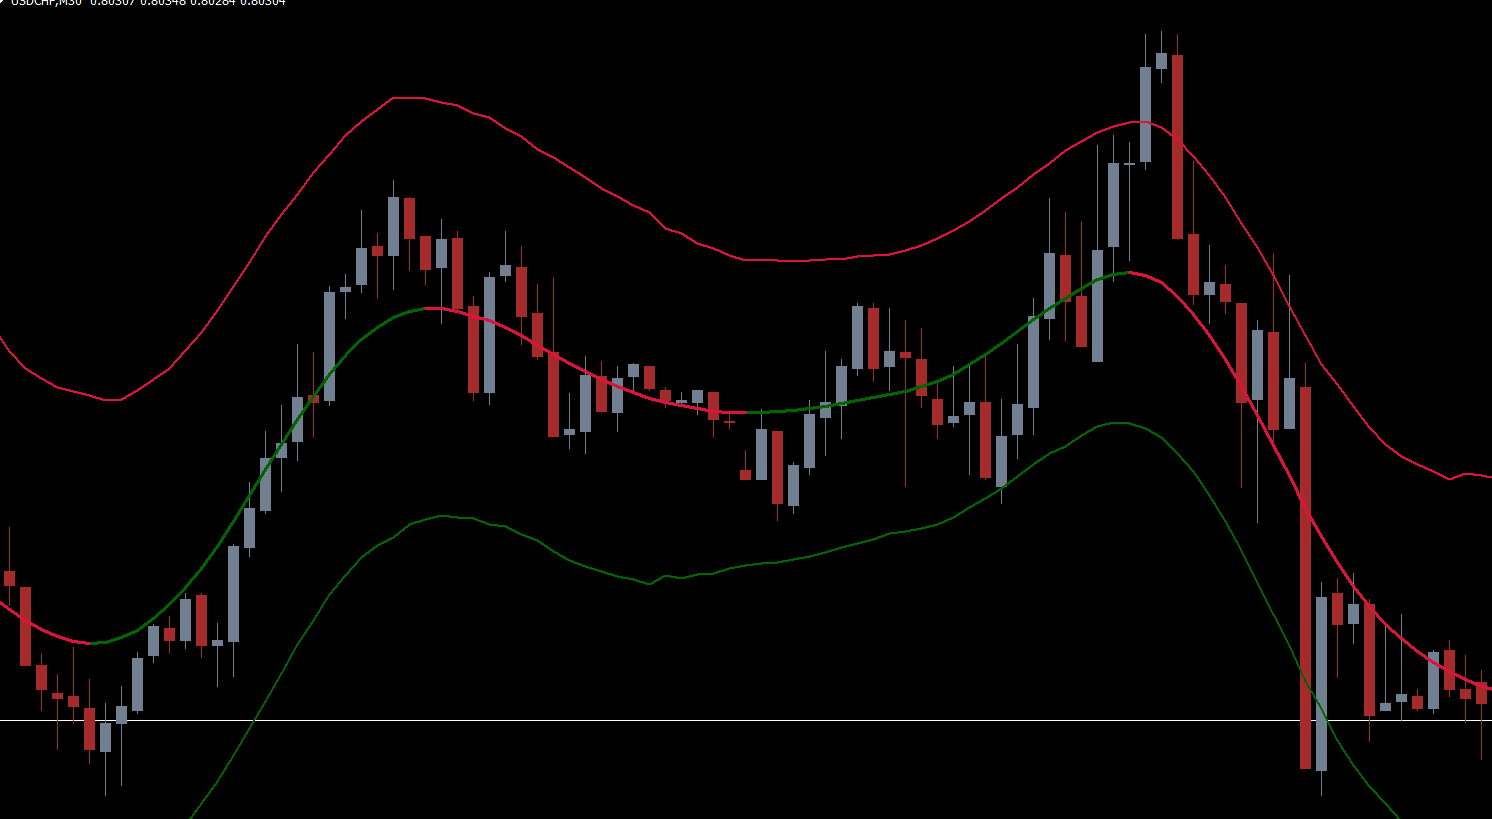
The TMA Centered Bands Indicator consists of three dynamic moving-average-based bands:
Upper Band (Red): Indicates potential overbought zones
Lower Band (Red): Indicates potential oversold zones
Middle Band (Red-Green): Changes color to show trend direction
The triangular moving average smooths Price Action more effectively than simple or exponential MAs, resulting in fewer false signals and cleaner chart interpretation.
As price fluctuates between the upper and lower bands, traders can anticipate potential reversals or continuations depending on how price interacts with these zones.
How the TMA Centered Bands Indicator Works
The indicator is built using triangular moving averages that assign more weight to the middle portion of the price range, creating smoother and more responsive bands.
Each band provides unique value:
Upper Band – Overbought Zone
When price closes above the upper band:
The market is likely stretched
A bearish correction or full reversal may follow
Short opportunities become more favorable
Lower Band – Oversold Zone
When price dips below the lower band:
The market may be oversold
A bullish reversal or bounce is likely
Long opportunities become attractive
Middle Band – Trend Filter
The middle band shifts color:
Green = Uptrend
Red = Downtrend
This helps identify trend direction instantly and filters out low-probability trades.
How to Trade the TMA Centered Bands Indicator
The TMA Centered Bands Indicator can be used for bounce trading, trend trading, reversal trading, and swing trading. Below are the most reliable strategies.
TMA Centered Bands Buy Strategy (Long Setup)
Conditions
Price must dip below the lower band — indicates oversold conditions.
Wait for the market to continue its move and show signs of stabilizing.
Enter the long trade near the lower band once price starts to reverse.
Stop-loss: Place below the swing low of the entry candle.
Exit the trade when the middle band turns red, signaling trend weakness.
Why It Works
This approach captures reversals at extreme price levels while using the middle band as an intelligent exit indicator.
TMA Centered Bands Sell Strategy (Short Setup)
Conditions
Price must rise above the upper band — indicating overbought conditions.
Wait for the price to stall and reverse downward.
Enter a short position near the upper band.
Stop-loss: Place above the swing high.
Exit the trade when the middle band turns green, signaling bullish pressure.
Why It Works
This method allows traders to capitalize on exhaustion zones and early trend reversals.
Advantages of the TMA Centered Bands Indicator
Works on all timeframes (Scalping, intraday, swing, long-term)
Easy visual interpretation for beginners
Helps identify reversal points with high accuracy
Excellent for trend direction filtering
Reduces price noise due to TMA smoothing
Versatile; useful in trending and ranging markets
Limitations
Like any indicator:
It is not a holy-grail system
Repainting may occur on older TMAs depending on version
Should not be used alone in highly volatile markets
For best results, combine it with:
RSI (to confirm overbought/oversold levels)
Moving Averages (to validate trend direction)
Price Action (candlestick patterns, support/resistance)
Conclusion
The TMA Centered Bands Indicator for MT4 is a powerful, flexible, and visually intuitive tool for identifying trend direction, potential reversals, and strong entry/exit zones. Whether you are a beginner or an experienced trader, this indicator offers a reliable framework for analyzing Market Structure and timing your trades effectively.
You can use it alone, but combining it with other confirmation indicators significantly improves accuracy. Since it works on every timeframe, it can fit into almost any trading strategy—scalping, day trading, or swing trading.
FAQ
23 Downloads
Published:
Nov 29, 2025 09:19 AM
Category: