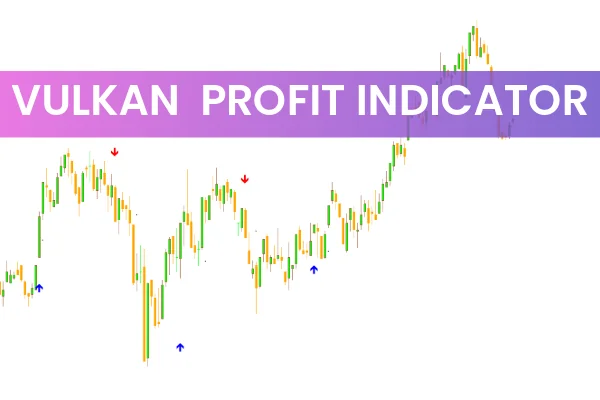
The Vulkan Profit Indicator is a straightforward yet highly effective MT4 Trend Indicator designed to help traders easily identify bullish and bearish market movements. By combining the VWMA (Volume-Weighted Moving Average) with fast and slow EMAs (Exponential Moving Averages), this tool generates blue and red arrows that indicate trend direction and potential trading opportunities.

At IndicatorForest.com, traders can download the Vulkan Profit Indicator for free and explore its accuracy in various market conditions.
How the Vulkan Profit Indicator Works
The Vulkan Profit Indicator’s logic is based on a combination of moving averages that track both Price Action and trading volume. When momentum shifts, the indicator plots visual signals directly on your MT4 chart:
Blue Arrow (BUY Signal): Indicates the start of a bullish trend and a potential long entry.
Red Arrow (SELL Signal): Signals the beginning of a bearish trend and a potential short entry.
Black Dots: Represent Trend Continuation or a possible reversal depending on their position relative to the arrows.
This simple yet data-backed method gives traders an easy way to interpret the market without relying on complex analysis tools.
How to Use the Vulkan Profit Indicator for MT4
Apply the Indicator to Your Chart
After downloading the indicator from IndicatorForest.com, attach it to any MT4 chart and select your preferred timeframe. The indicator automatically plots the arrows and dots once it detects directional momentum changes.
Interpret the Signals
The GBP/USD H4 chart is a great example of how the Vulkan Profit Indicator works:
When a blue arrow appears, it indicates a BUY setup. Enter a long position and follow the uptrend.
When a red arrow appears, it indicates a SELL setup. Go short to capitalize on the downward move.
Use the Black Dots to Confirm Trends
Black dots are crucial in this indicator’s system. Their placement provides additional confirmation:
Continuation Dots: When black dots appear immediately after an arrow, it means the trend is likely to continue.
Reversal Dots: If dots appear later in the trend, it may signal a possible reversal.
Understanding these dots helps you decide whether to stay in a trade or exit early to lock in profits.
Best Timeframes and Market Conditions
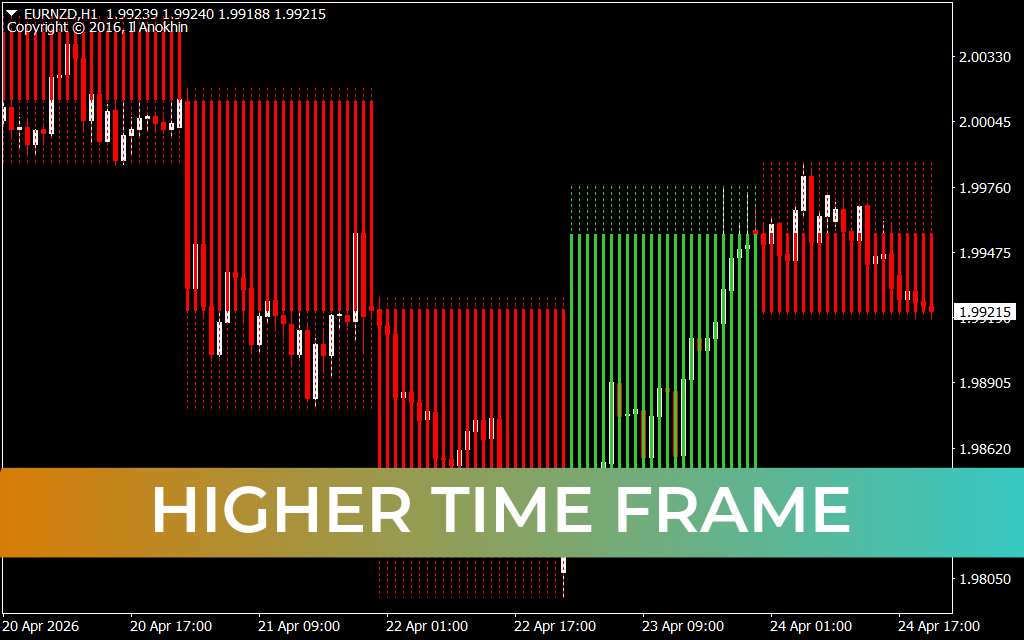
While you can apply the Vulkan Profit Indicator on any timeframe, higher timeframes such as H1, H4, or D1 tend to produce more reliable results. Lower timeframes may show false signals due to short-term volatility.
To improve accuracy, consider combining this indicator with other tools such as:
Support And Resistance levels
Price action confirmations
Trendline breakouts
This multi-layered approach enhances your confidence in the Vulkan Profit Indicator’s signals.
Conclusion
The Vulkan Profit Indicator for MT4 offers traders a clean, visual way to identify trend direction, continuation, and reversal points. Its blue and red arrows show precise entry signals, while black dots provide insights into market momentum.
If you’re looking for a simple, accurate MT4 trend indicator, the Vulkan Profit Indicator is a must-have tool. Download it for free today at IndicatorForest.com and start improving your trading accuracy instantly.
FAQ
33 Downloads
Published:
Nov 11, 2025 21:41 PM
Category: