The Sidus Indicator for MT4 is a straightforward yet powerful trading tool that helps traders identify trend direction using a combination of Moving Averages (MAs) and colored arrows. It simplifies the process of reading market momentum and trend changes, making it especially useful for both beginners and experienced traders.
The indicator consists of two main elements:
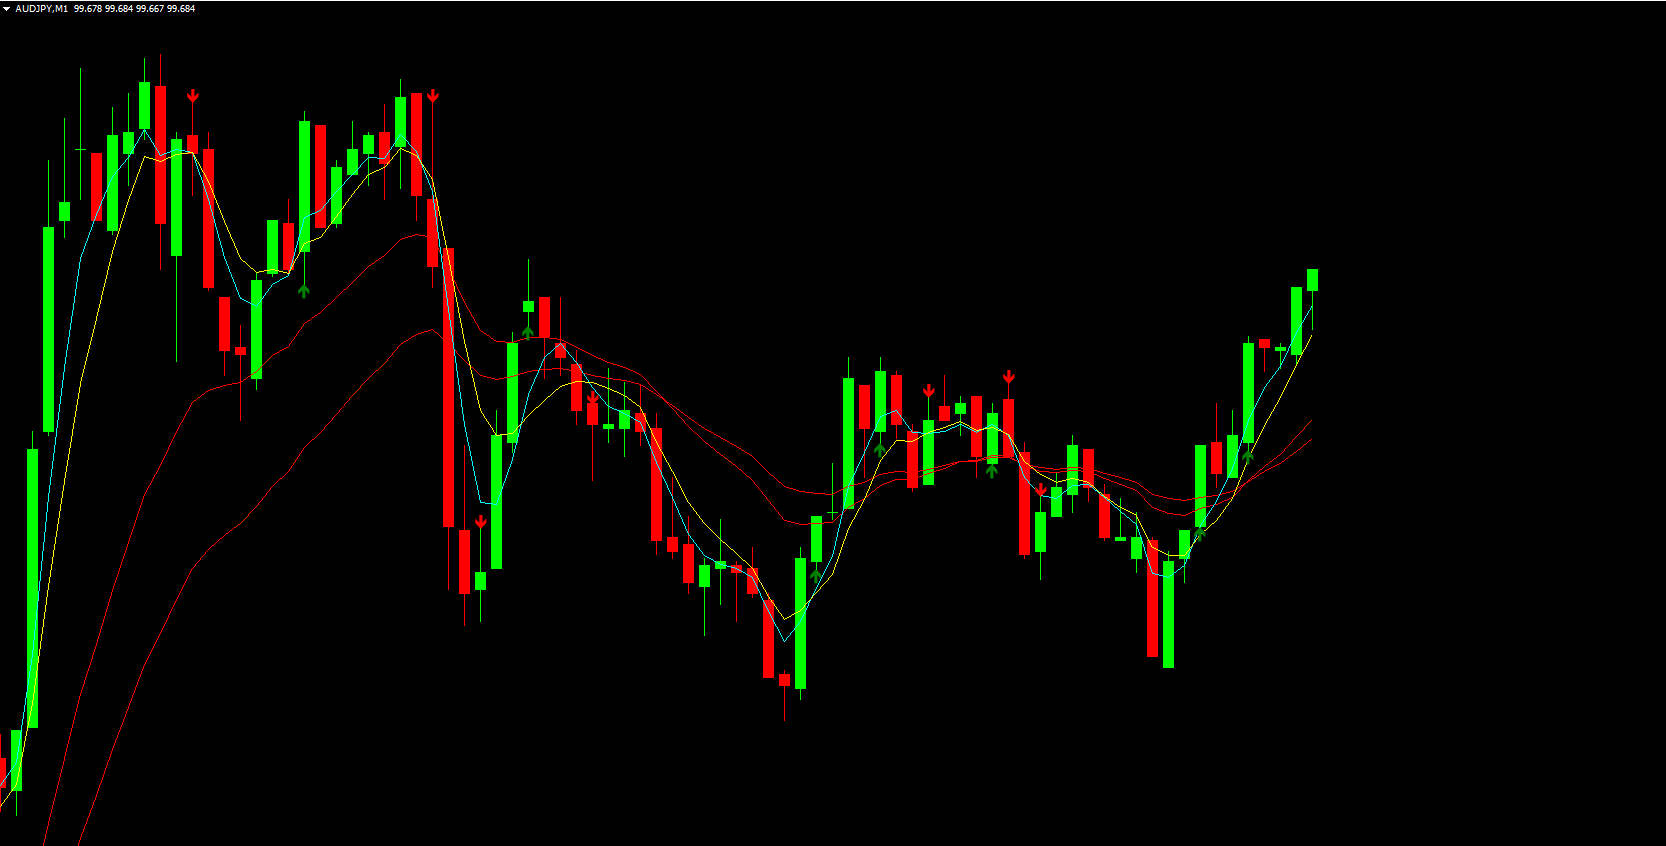
Moving Averages (MAs): Four different MAs are plotted on the chart, representing both short-term and long-term market trends.
Arrows:
Green Arrows indicate potential buy signals (uptrend).
Red Arrows indicate potential sell signals (downtrend).
Together, these components provide visual cues to confirm the direction of the market and help traders make more informed trading decisions.
How the Sidus Indicator Works
The Sidus Indicator for MetaTrader 4 works by analyzing the relationship between price movements and multiple MAs. When the price moves above the MAs and a green arrow appears, it suggests that buyers are in control. Conversely, when the price moves below the MAs and a red arrow appears, it signals that sellers are taking over.
Because Moving Averages are based on historical data, they tend to lag behind Price Action, which can sometimes cause delayed signals. However, when combined with the arrows, the indicator provides clearer trend confirmation.
This makes it ideal for traders who prefer a trend-following approach or want additional confirmation before entering a trade.
How to Use the Sidus Indicator for MT4
Using the Sidus Indicator is simple, but understanding its signals can help you use it more effectively.
Basic Method: Using Arrows Only
The most straightforward way to trade with the Sidus Indicator is by following the arrows:
Green Arrow: Enter a buy trade.
Red Arrow: Enter a sell trade.
However, this method can generate false signals, especially during sideways markets. The arrows may also repaint — meaning they might appear and disappear while a candle is forming — so relying on them alone can be risky.
Advanced Method: Combining Arrows with MAs
A more accurate approach is to combine the arrows with the position of price relative to the MAs:
Buy Signal: Price moves above all MAs and a green arrow appears.
Sell Signal: Price moves below all MAs and a red arrow appears.
This method offers stronger confirmation and helps filter out false entries.
Timeframe and Strategy Tips
The Sidus Indicator works on all timeframes, but due to the lagging nature of MAs, it’s best to analyze the overall trend on a higher timeframe (like H4 or D1) before taking trades on shorter timeframes (M15 or M30).
Scalpers and intraday traders can use this top-down approach to align their trades with the dominant trend. Additionally, combining the Sidus Indicator with tools such as RSI, MACD, or candlestick patterns can further enhance signal reliability.
Advantages of the Sidus Indicator
Clear visual signals with colored arrows and MAs.
Works on all timeframes and currency pairs.
Trend confirmation tool suitable for beginners.
Can be combined with other indicators for stronger signals.
Free and easy to install on MetaTrader 4.
Limitations
While the Sidus Indicator is effective for identifying trends, it’s important to be aware of its limitations:
The arrows can repaint during live candle formation.
False signals can occur in choppy or sideways markets.
Works best as a confirmation tool, not a standalone system.
Conclusion
The Sidus Indicator for MT4 combines moving averages and arrow signals to make trend identification easy and visual. By using both elements together, traders can confirm potential entries and exits with greater confidence.
However, since the indicator can repaint and lag during volatile conditions, it’s best used alongside other technical analysis tools for confirmation.
You can download the Sidus Indicator for free and explore other advanced trading tools at IndicatorForest.com — your trusted source for professional MetaTrader indicators and trading systems.
FAQ
5 Downloads
Published:
Nov 08, 2025 14:28 PM
Category: