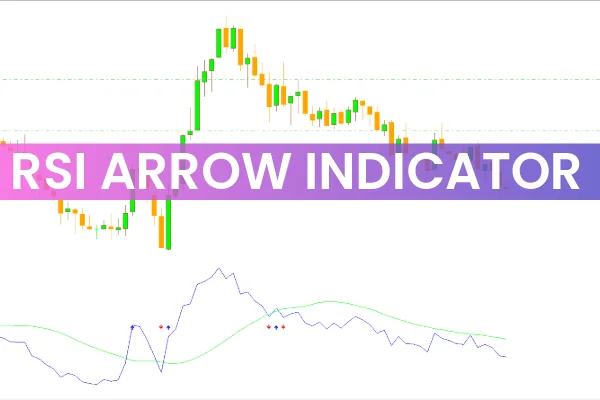
The RSI Arrow Indicator for MT4 is a powerful tool that enhances the traditional Relative Strength Index (RSI) by adding clear visual cues for buy and sell opportunities directly on your trading chart. Instead of relying solely on RSI values, traders can easily interpret market momentum through colored arrows, helping them act quickly on trading signals.
By combining RSI readings with an Exponential Moving Average (EMA) filter, the indicator offers more accurate and timely signals. This makes it ideal for traders who want to reduce guesswork and improve decision-making when analyzing overbought or oversold conditions.
How the RSI Arrow Indicator Works
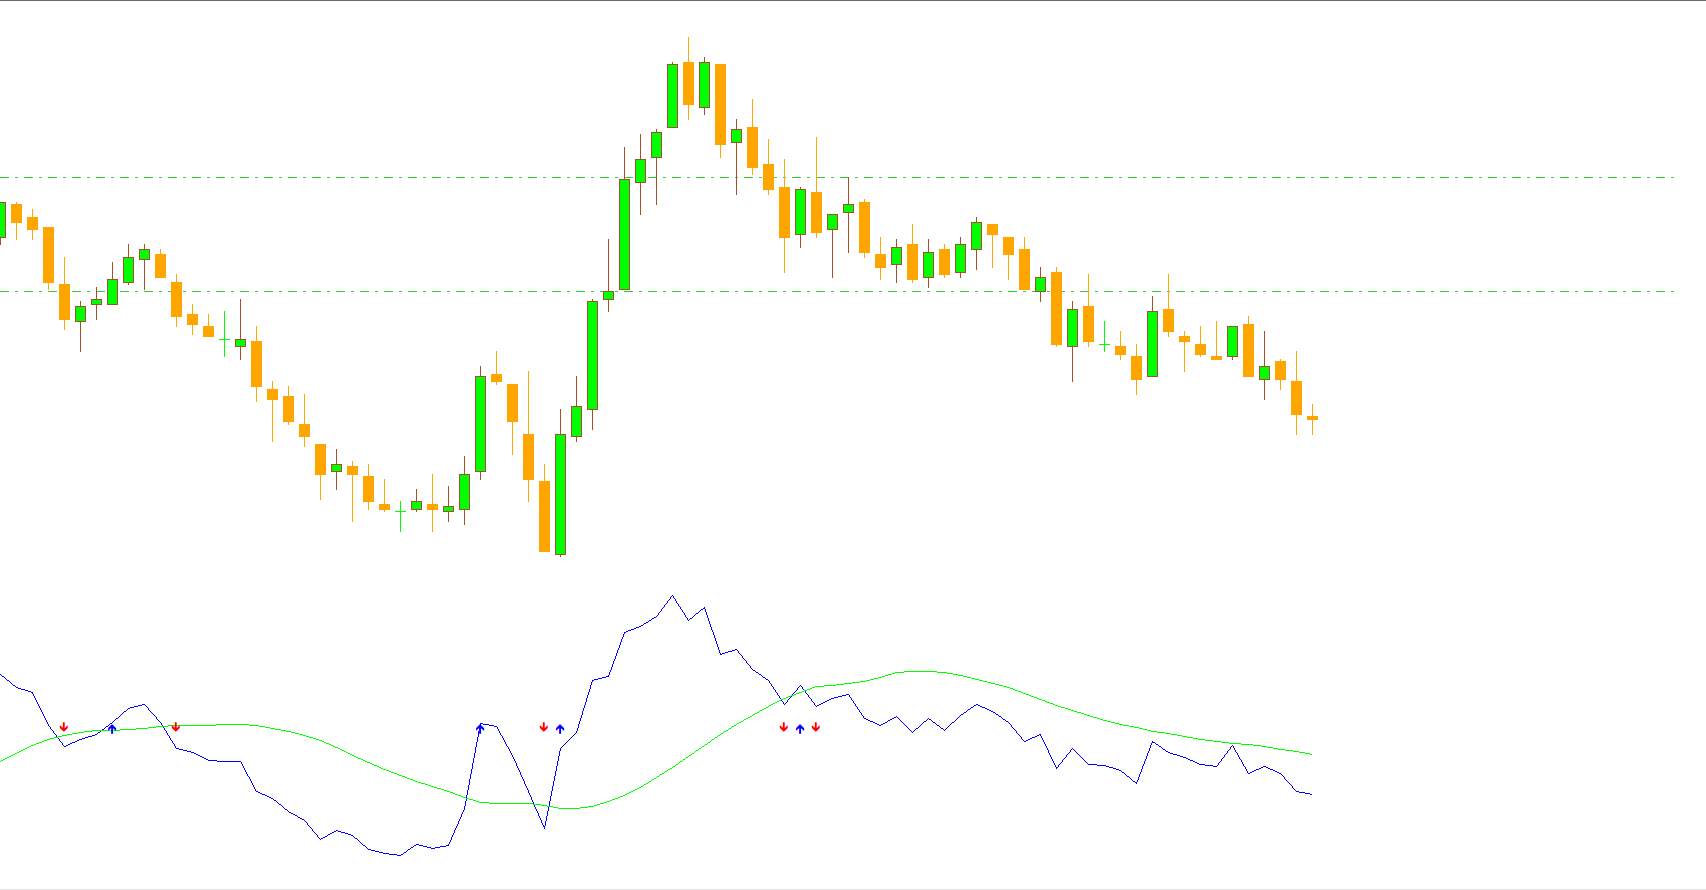
The RSI Arrow Indicator for MT4 functions by tracking the crossover points between the RSI line and an EMA applied to it. These crossover points signal potential trend reversals or continuations, which are displayed as arrows on the chart.
Green Arrow (Buy Signal): Appears when the RSI crosses above the EMA, indicating rising bullish momentum. This often occurs when the market has been oversold and is reversing upward.
Red Arrow (Sell Signal): Appears when the RSI crosses below the EMA, signaling potential bearish momentum. This typically follows overbought conditions, suggesting a downward move may occur.
These signals are visually plotted on your price chart, allowing traders to spot entry and exit opportunities instantly—without constantly monitoring RSI values or switching between indicators.
RSI Arrow Indicator Trading Signals and Strategy
This indicator simplifies RSI-based trading strategies by clearly marking actionable moments:
Buy Entry: When a green arrow appears, traders can open a long position. A good confirmation is when the RSI is below 50 and turning upward.
Sell Entry: When a red arrow shows up, it indicates a potential downtrend. Traders can enter a short position if the RSI is above 50 and trending lower.
Stop Loss and Take Profit: Place a stop loss below the previous swing low for buy trades or above the previous swing high for sell trades. Take profit targets can be set at key support/resistance levels or using a fixed risk-reward ratio (e.g., 1:2).
This indicator performs well across all timeframes, making it suitable for Scalping, day trading, and swing trading strategies.
Benefits of Using the RSI Arrow Indicator for MT4
Simplifies RSI Interpretation
Instead of reading RSI numbers manually, traders can rely on visual arrows for quick trade decisions.
Improves Signal Accuracy
The EMA filter reduces false RSI signals, improving the quality of trade entries.
Works on All Assets and Timeframes
Whether you trade forex, commodities, or indices, the indicator adapts to various markets and chart intervals.
Ideal for Beginners and Experts
New traders benefit from the clarity of signals, while experienced traders can use it as a confirmation tool alongside other strategies.
Conclusion
The RSI Arrow Indicator for MT4 transforms RSI analysis by integrating EMA-based filters and visual trade signals directly on your charts. It helps traders quickly recognize buy and sell opportunities, streamline analysis, and enhance overall trading precision.
If you’re looking for a simple yet effective way to interpret RSI data, this indicator is a must-have. You can download the RSI Arrow Indicator for free and explore many other professional forex tools at IndicatorForest.com.
3 Downloads
Published:
Nov 04, 2025 13:50 PM
Category: