Mastering Volatility with the SDX-TZ Breakout Indicator
Trading breakouts is one of the most profitable strategies in the Forex market, but it is also one of the most psychologically taxing. Identifying the exact moment price breaches a significant consolidation zone requires patience and precision. The SDX-TZ Breakout Indicator is a professional-grade technical tool designed to automate this process, highlighting critical Support And Resistance zones based on specific time ranges or volatility expansion.
Understanding the SDX-TZ Breakout Logic
The "TZ" in SDX-TZ often stands for "Time Zone," as the indicator is frequently used to map out the highs and lows of specific trading sessions, such as the Asian range or the London open. By identifying these horizontal boundaries, the indicator provides a visual framework for "box breakouts."
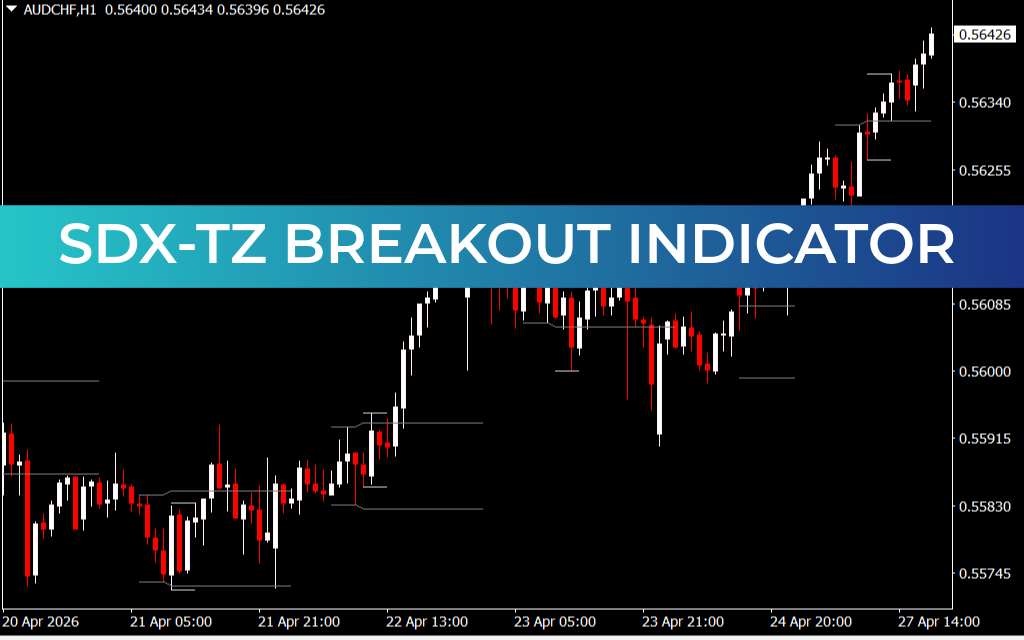
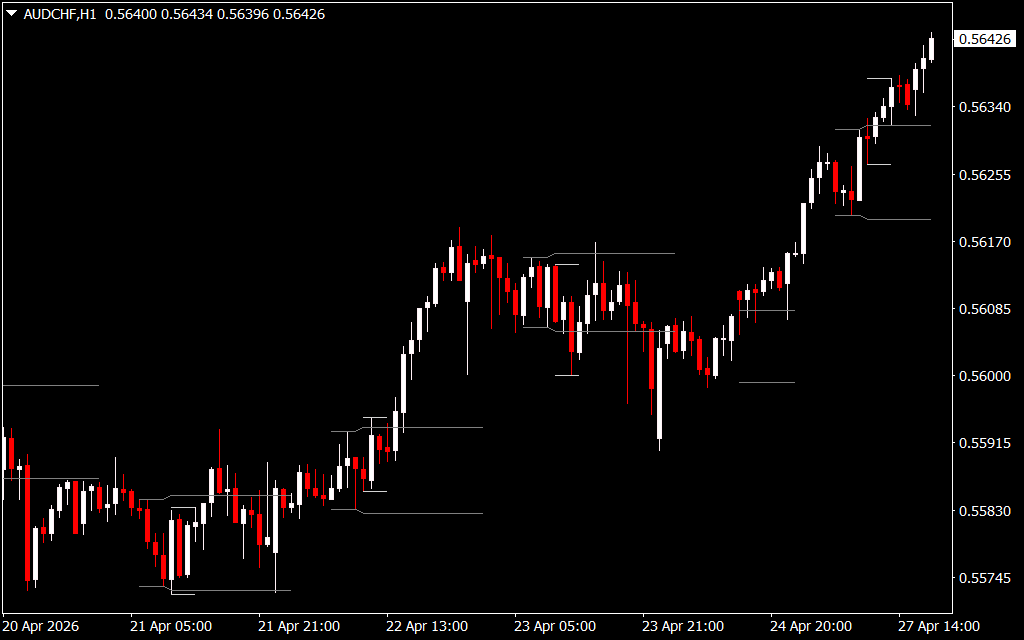
As seen in the provided AUD/CHF H1 chart, the indicator draws clean, horizontal gray lines that extend from specific price levels.
- Support & Resistance Levels: These lines represent "ceiling" and "floor" levels where price has previously stalled.
- Price Reaction: Notice how price tends to respect these levels until a surge in momentum forces a breakout. Once a level is broken, it often flips—old resistance becomes new support.
Why Breakout Trading Works
Markets spend approximately 70% of their time ranging and only 30% trending. The SDX-TZ Breakout Indicator helps you survive the range and capitalize on the trend. When price is trapped between the indicator's lines, it signals a period of accumulation. The subsequent breakout is the market’s way of seeking a new value area, often resulting in rapid price movement that can yield high risk-to-reward ratios.
Strategic Application: The "Break and Retest"
While many traders jump into a trade the moment a line is pierced, the most successful strategy using the SDX-TZ is the Break and Retest:
- The Break: Wait for a full candle body to close above or below the SDX-TZ horizontal line.
- The Retest: Watch for price to return to that line. If the line holds, it confirms that the breakout is genuine and not a "fakeout."
- The Entry: Enter in the direction of the break with a stop loss placed back inside the previous range.
On the H1 timeframe shown, this indicator is particularly powerful for swing traders who want to catch the "big move" of the week. By identifying the key zones from the previous 24 hours, the SDX-TZ gives you a clear roadmap for the coming session's potential targets.
Conclusion
The SDX-TZ Breakout Indicator removes the guesswork from technical analysis. Instead of manually drawing lines that may be subjective, this tool provides mathematically derived levels that the market historically respects. Whether you are Scalping session opens or holding long-term trends, the SDX-TZ is a foundational tool for any MT4 setup.
3 Downloads
Last Update:
Apr 27, 2026 21:42 PM
Published:
Feb 01, 2026 12:59 PM
Category: