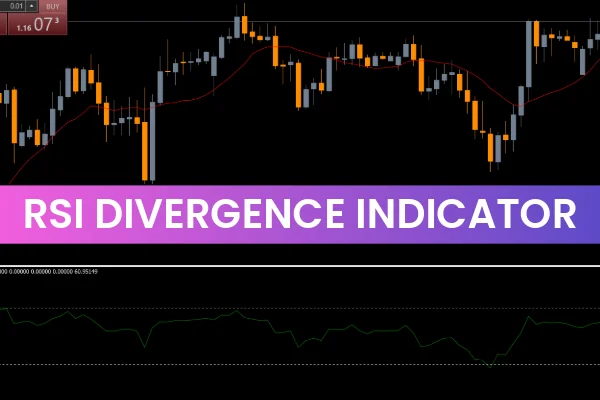
The RSI Divergence Indicator for MT4 is a powerful technical tool designed to identify early reversal signals when Price Action and momentum fail to move in the same direction. Traders use this indicator to detect bullish or bearish divergences, revealing when a trend is weakening and preparing to reverse. Unlike the standard RSI, which rarely reaches overbought or oversold zones, the divergence indicator generates more precise, actionable setups for forex, crypto, and indices.
Using RSI divergence enables traders to spot hidden shifts in market behavior, anticipate trend reversals, and improve overall trade timing. Whether you are a beginner or an experienced analyst, understanding divergence is essential for accurate market forecasting.
Understanding RSI Divergence Indicator for MT4
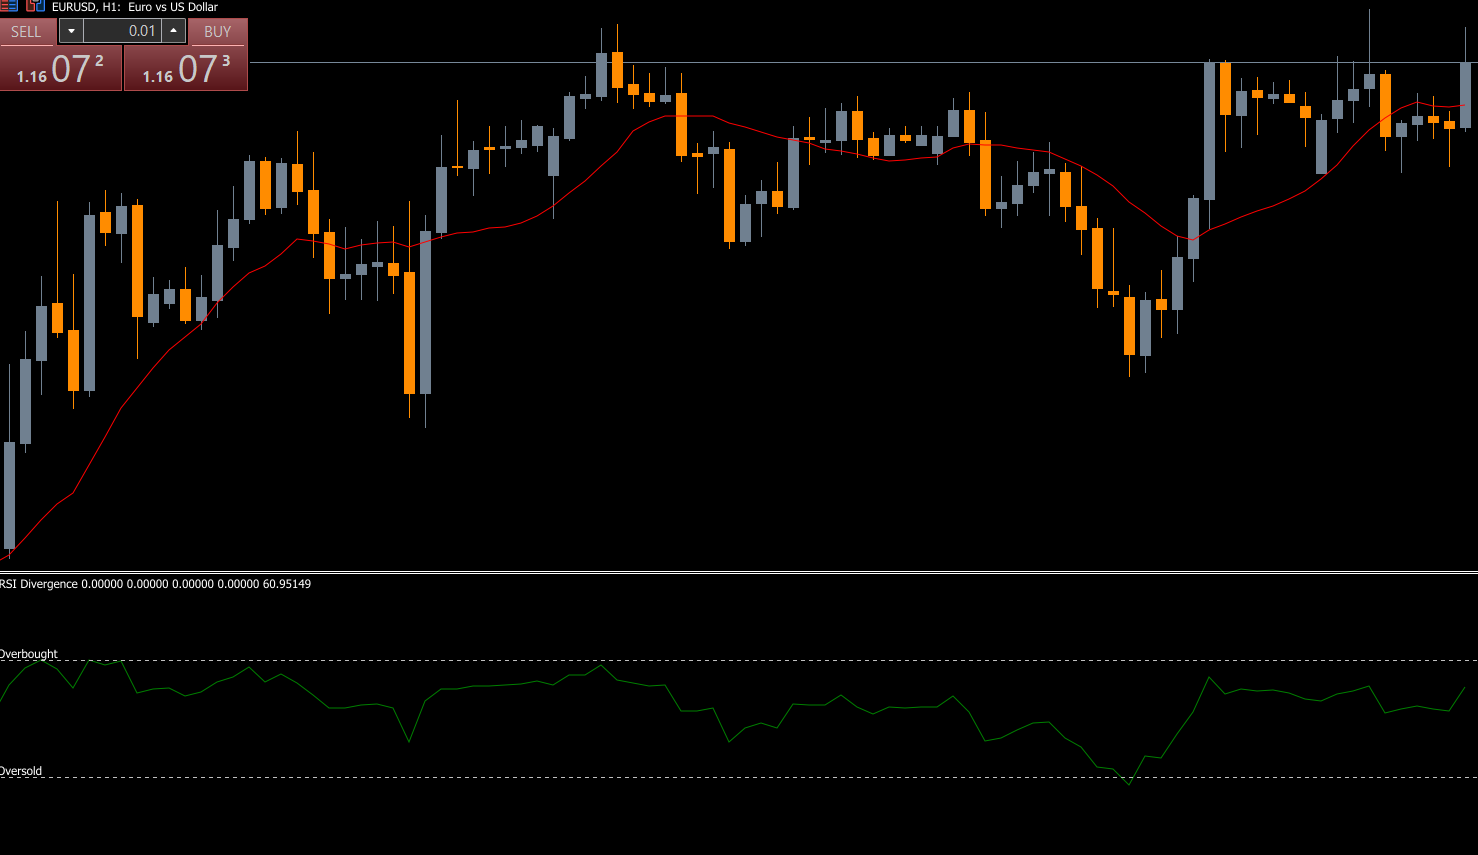
The RSI (Relative Strength Index) is a widely used momentum oscillator that measures price strength on a scale from 0 to 100. Traditionally, values below 30 indicate oversold conditions, while values above 70 suggest overbought conditions. However, the standard RSI often fails to reach extremes, resulting in fewer signals.
This is where the RSI Divergence Indicator shines. Divergence occurs when the indicator moves opposite to price, signaling that momentum is disconnecting from current market direction.
Types of RSI Divergence
Bullish Divergence
A bullish divergence forms when price makes lower lows, but the RSI forms higher lows. This indicates that sellers are losing strength even though price continues to fall. Traders consider this a strong reversal signal that the market may soon rise.
Bearish Divergence
A bearish divergence occurs when price forms higher highs, but RSI forms lower highs. This reveals weakening buying pressure and hints at a potential downward reversal.
Both types of divergences help traders anticipate turning points well before traditional indicators confirm trend changes.
Buy and Sell Signals with RSI Divergence Indicator
The RSI Divergence Indicator for MT4 simplifies detecting buy and sell signals by automatically highlighting bullish or bearish divergence on the chart.
Buy Signals
A buy setup occurs when:
Price creates lower lows
RSI forms higher lows
A reversal candle appears or RSI reaches oversold territory
Traders can place a stop-loss below the recent swing low and target the next resistance zone or opposite divergence signal.
Sell Signals
A sell setup forms when:
Price creates higher highs
RSI shows lower highs
A bearish rejection candle forms or RSI enters the overbought area
Stop-loss is typically positioned above the recent swing high.
Why RSI Divergence Indicator Is Better Than Standard RSI
The classic RSI is prone to producing limited or delayed signals. In contrast, the divergence indicator:
Identifies reversals earlier
Provides more frequent trade opportunities
Helps avoid fake breakouts
Works well with Candlestick Patterns and trendlines
Improves accuracy in trending and ranging markets
This makes it a valuable addition to any MT4 trading system.
Best Practices for Using RSI Divergence Indicator
Combine With Trendlines
Drawing trendlines helps validate divergence-based signals and filter noise.
Use Volume or Moving Averages
Momentum confirmations from moving averages or volume indicators strengthen your entry confidence.
Trade Higher Timeframes
RSI divergence on H1, H4, or Daily charts produces more reliable and stable signals.
Final Thoughts
The RSI Divergence Indicator for MT4 is a highly reliable tool for identifying early market reversals. By combining RSI momentum analysis with divergence detection, traders gain a clearer understanding of potential trend changes. Whether you trade forex, indices, metals, or crypto pairs, this indicator enhances your technical analysis and decision-making.
To download more high-quality trading tools, visit IndicatorForest.com and explore our complete library of premium and free indicators designed for MT4 and MT5 traders.
FAQ
2 Downloads
Published:
Dec 01, 2025 02:55 AM
Category: