The RSI Candles MTF Indicator for MT4 (Relative Strength Indicator Candles Multi-Timeframe) is a unique trading tool that integrates RSI values directly into candlestick colors. It helps traders instantly identify overbought and oversold market conditions across multiple timeframes—without cluttering the chart.
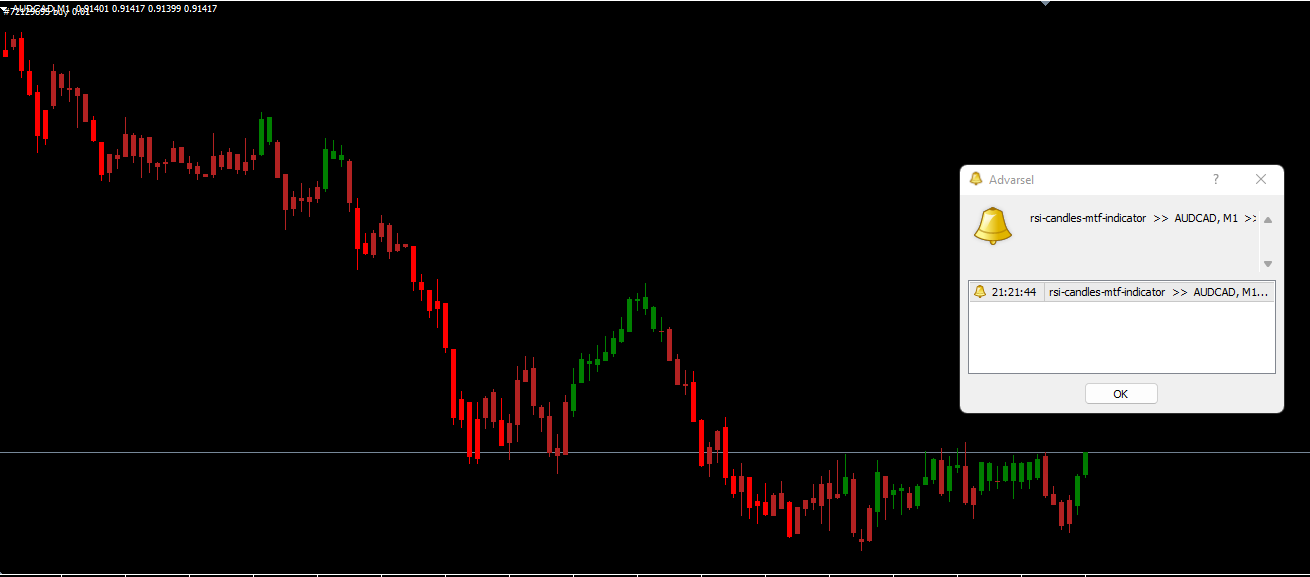
Unlike traditional RSI indicators that appear in a separate window, this tool overlays RSI data on the main chart, turning candlesticks green when RSI moves above the 50 level and red when it drops below. The result is a cleaner, more intuitive view of market momentum.
This indicator is especially useful for traders who want quick RSI insights without switching between chart windows or adding multiple sub-indicators.
How the RSI Candles MTF Indicator Works
The RSI Candles MTF Indicator MT4 uses the RSI calculation to color candlesticks according to market strength:
Green Candlestick: RSI > 50, indicating potential bullish momentum or upward trend.
Red Candlestick: RSI < 50, suggesting bearish momentum or possible downward pressure.
It also supports multi-timeframe (MTF) analysis — meaning traders can view RSI data from a higher timeframe (like H1 or H4) while trading on a lower one (like M15). This alignment helps confirm the dominant trend before entering trades.
The indicator keeps your chart neat and visually appealing, giving you the freedom to combine it with other tools like Moving Averages, trendlines, or candlestick patterns.
How to Trade with the RSI Candles MTF Indicator for MT4
The RSI Candles MTF Indicator does not provide direct buy or sell signals, but it helps identify potential trade zones based on RSI behavior. Here’s how to interpret it effectively:
Bullish Scenario
When candlesticks turn green, it means RSI has crossed above the 50 level, signaling that buying pressure is increasing.
Confirm with bullish Price Action patterns (e.g., hammer or bullish engulfing).
Consider a long entry if the overall trend aligns with higher timeframe RSI strength.
Bearish Scenario
When candlesticks turn red, RSI has dropped below 50, hinting at growing selling pressure.
Wait for confirmation from bearish candlestick formations (e.g., shooting star or bearish engulfing).
Take a short position if the trend direction agrees with RSI weakness.
Remember: the indicator is not a standalone trading signal. It should be used in combination with price action, support/resistance levels, or trend indicators for confirmation.
Benefits of the RSI Candles MTF Indicator
Multi-Timeframe Analysis: View RSI trends from higher timeframes without changing charts.
Clear Visualization: Colors make it easy to interpret momentum directly on candlesticks.
Less Chart Clutter: Frees up space for technical drawings or other indicators.
Flexible Usage: Works with all assets — forex, commodities, indices, and crypto.
All-Timeframe Compatibility: Suitable for Scalping, day trading, and swing trading.
Tips for Best Results
Combine with the ADX Smoothed Indicator or Moving Average for trend confirmation.
Avoid overtrading when RSI fluctuates near the 50 level — this signals market indecision.
Always use stop losses and proper risk management when trading momentum shifts.
Conclusion
The RSI Candles MTF Indicator for MT4 brings RSI analysis directly onto price charts, offering a clear, uncluttered view of market momentum across multiple timeframes. By combining RSI strength visualization with your preferred trading strategy, you can identify overbought and oversold conditions with greater precision.
Download the RSI Candles MTF Indicator for free at IndicatorForest.com and explore dozens of advanced MT4 and MT5 indicators designed to boost your trading accuracy.
3 Downloads
Published:
Nov 06, 2025 11:25 AM
Category: