The ROC indicator for MT4 (Rate of Change) is a powerful momentum oscillator that measures the percentage change between the current closing price and the closing price “n” periods earlier. It helps traders identify early bullish or bearish trend shifts, making it an essential tool in technical analysis. Forex traders use ROC to detect trend reversals, divergences, and market strength—and even manage exits when price loses momentum. For broader momentum insights, the ROC Multi Currency Indicator and ROC Smoothed Indicator serve as excellent complementary tools.
One of the most impressive aspects of the ROC indicator is how clearly it highlights early momentum changes, especially around the zero line, where sharp crossovers often signal potential trend reversals. Divergences between price and the indicator tend to stand out clearly, providing high-probability entry opportunities. However, in fast-moving markets the indicator may lag, making it more effective when combined with support/resistance levels, moving averages, or other confluence tools.
How the ROC Indicator Works
The ROC indicator plots as an oscillator with a Zero line and no fixed upper or lower limits. It reflects the speed and magnitude of price movement, allowing traders to interpret momentum strength easily.
Key features of the ROC indicator include:
Zero line crossovers
Momentum strength signals
Overbought/oversold behavior (without fixed levels)
Divergence and convergence patterns
Compatibility with multiple trading strategies
Because it lacks set boundaries, traders must apply caution when identifying extreme conditions. Still, both beginners and advanced traders use ROC to identify Trend Continuation or reversal setups.
Trading Methods Using the ROC Indicator on MT4
Zero Line Crossover Signals
The most common ROC trading strategy involves monitoring the oscillator's behavior around the zero line:
Bullish crossover: When ROC rises from below to above zero, it signals upward momentum. Traders may enter BUY positions, placing stop loss below the previous swing low.
Bearish crossover: When ROC drops from above to below zero, it indicates bearish momentum. Traders may open SELL trades with stop loss above the recent swing high.
If the ROC rises sharply above the zero line, the market may be entering a strong bullish phase. Likewise, a sudden drop below zero suggests a strong bearish phase.
Divergence and Convergence Strategies
Divergence remains one of the most powerful ways to trade with the ROC indicator:
Bullish divergence: Price makes a lower low while ROC forms a higher low
Bearish divergence: Price makes a higher high while ROC forms a lower high
These setups often highlight weakening market pressure and can predict reversals earlier than Price Action alone.
Convergence, which represents agreement between price and momentum, confirms trend continuation.
Support And Resistance on the ROC Indicator
A less common but effective method involves plotting support and resistance directly on the ROC oscillator.
Advanced traders draw:
Horizontal S/R lines
Trend channels
Breakout zones
These help identify when the oscillator is breaking structure, leading to a strong trend continuation when combined with price action.
Advantages and Disadvantages of the ROC Indicator
Pros
Clear momentum signals via zero line crossovers
Excellent divergence detection for high-probability trades
Free and easy to install on MetaTrader 4
Helps traders understand the pace and strength of price action
Cons
Lagging in fast markets, similar to other momentum indicators
No fixed overbought/oversold levels, requiring trader judgment
Works best when paired with other tools and price action
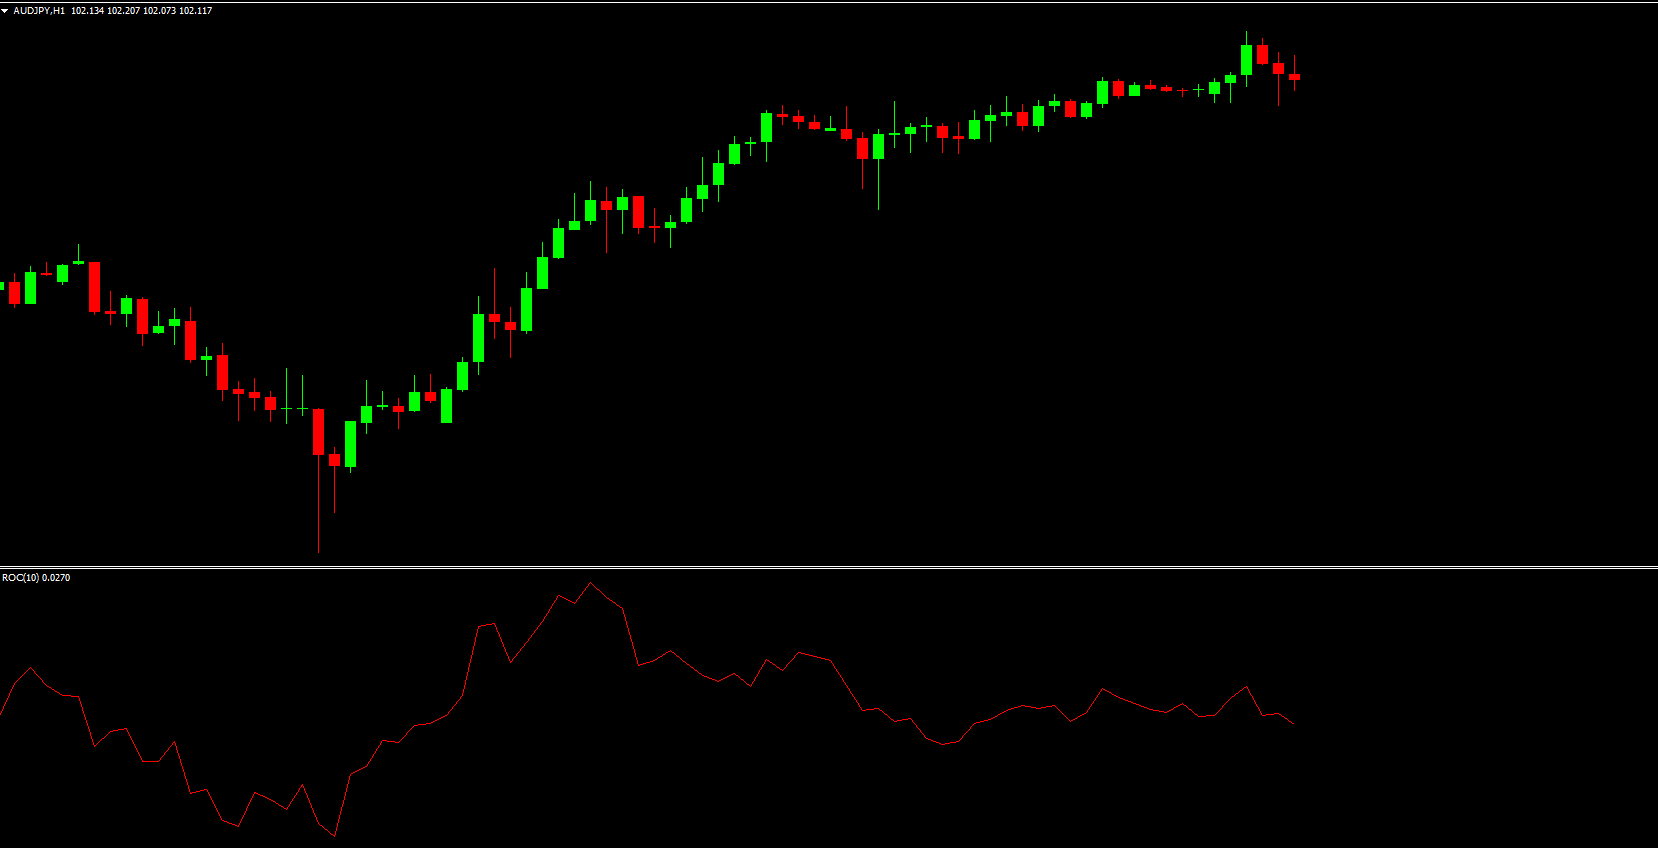
Real Chart Example (EURUSD H4)
When applied to an H4 EURUSD chart, the ROC indicator plots in red within a separate oscillator window. Traders can immediately identify zero line crossovers, momentum spikes, divergences, and trend weaknesses.
For example:
A bullish zero line break may signal a BUY opportunity.
A bearish drop below zero indicates a SELL.
Sharp ROCs above or below zero reflect strong directional moves.
The indicator’s clarity makes it useful both for beginners and advanced strategy traders.
Conclusion
The ROC indicator for MT4 is a versatile tool that offers multiple trading methods including zero line crossovers, divergence analysis, and momentum interpretation. Although it carries some lag and lacks bounded levels, it becomes highly effective when used with confluence tools like price action, moving averages, or Market Structure.
To improve your divergence trading, visit IndicatorForest.com and explore related tutorials, including our recommended article How to Identify Divergence in Forex.
FAQ
Published:
Nov 27, 2025 22:51 PM
Category: