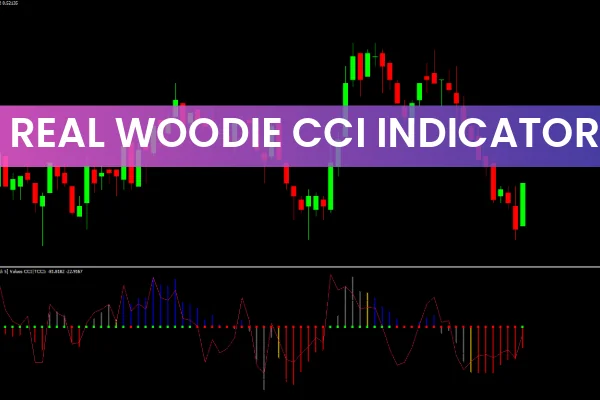
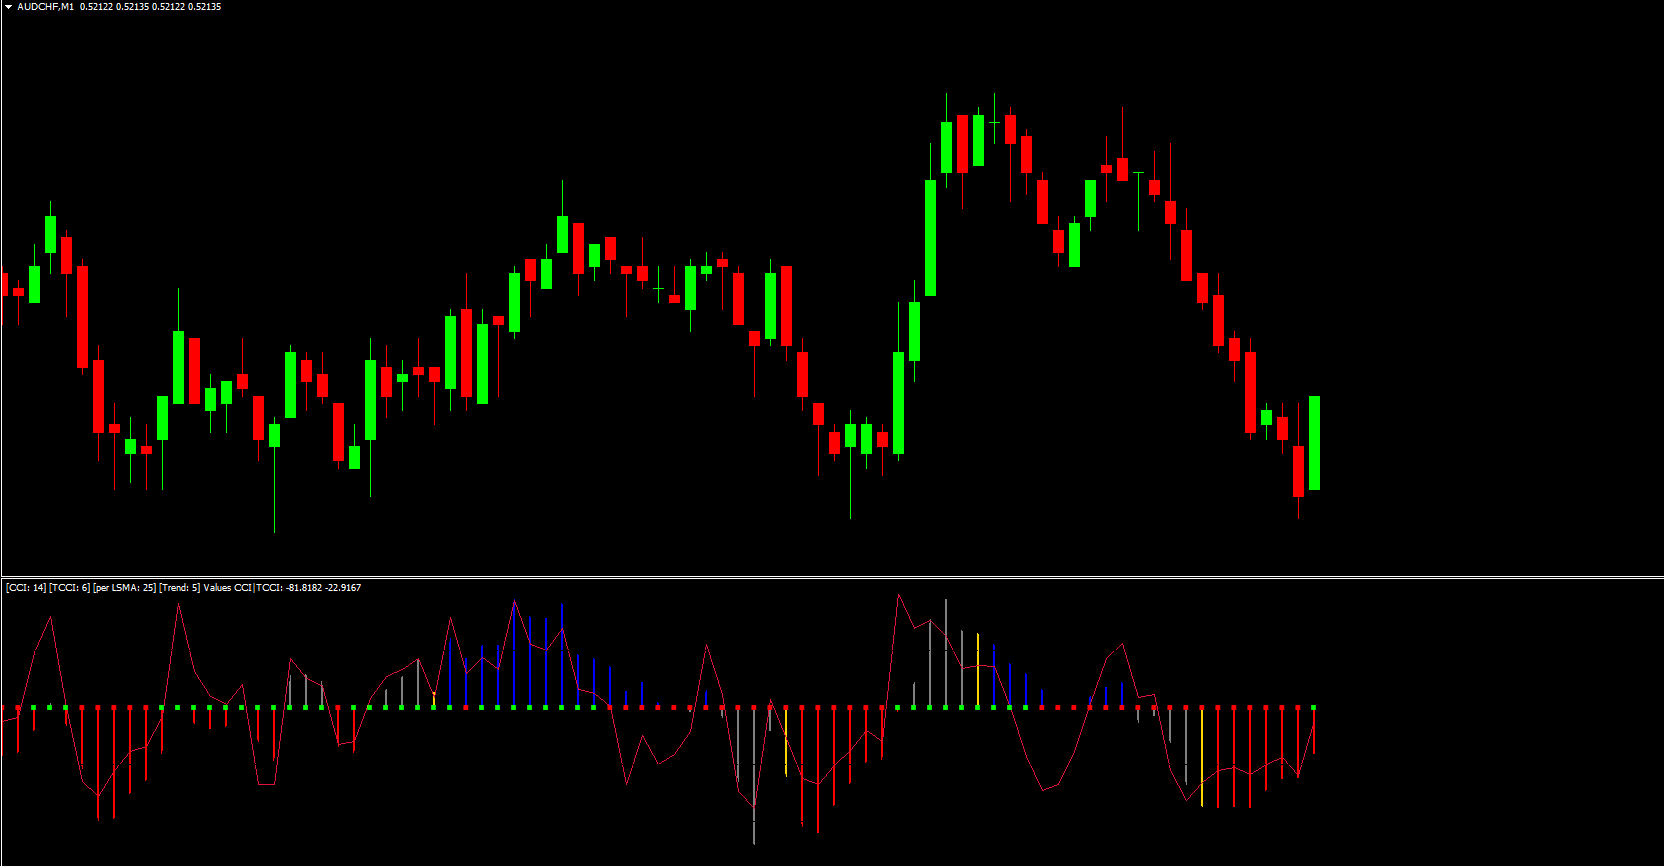
The Real Woodie CCI indicator is a simple yet highly effective MT4 tool that mirrors the traditional Commodity Channel Index (CCI). Many traders prefer it because it clearly displays market momentum using a moving average line and a signal line that identifies overbought and oversold conditions. The Real Woodie CCI oscillates naturally between –100 and +100, making it helpful for spotting potential BUY and SELL signals. This guide explains how it works, its best settings, and how to use it for smarter trading decisions.
What Is the Real Woodie CCI Indicator?
The Real Woodie CCI indicator is designed to look identical to the standard CCI, but it simplifies the visual layout so traders can quickly identify momentum shifts. It uses:
A moving average (MA)-style line
A signal line indicating entry and exit opportunities
Clear oscillation between –100 and +100
Because of its streamlined design, the indicator helps traders spot trend reversals, momentum shifts, and potential overextensions in price.
How the Real Woodie CCI Generates BUY and SELL Signals
Overbought and Oversold Levels
Like the traditional CCI, the Real Woodie CCI produces reliable signals when price momentum moves beyond extreme zones.
Above +100 → Overbought zone → Potential BUY trend continuation or early reversal alert
Below –100 → Oversold zone → Potential SELL Trend Continuation or reversal alert
The strength of the signal increases when the indicator stays beyond these levels for multiple candles.
Using Multiple Timeframes
One major benefit of the Real Woodie CCI is that it works on any timeframe. However:
Longer timeframes (H4, Daily, Weekly) → Reduce false signals and reveal dominant trends
Shorter timeframes (M5, M15, M30) → Help pinpoint pullbacks and precise entries
Professional traders often combine timeframes—one for trend direction and one for entries—to increase accuracy.
Practical Example: GBP/USD Trend Signals
On a GBP/USD H4 chart, the Real Woodie CCI highlights clear BUY and SELL signals.
When the line crosses above +100, a buy signal may form.
When it drops below –100, a sell signal may form.
This helps traders avoid emotional decisions by relying on objective momentum data.
What the Real Woodie CCI Indicator Tells You
The Real Woodie CCI reveals:
Momentum strength
Trend continuation or exhaustion
Overbought/oversold zones
Early market reversals
Possible price breakouts
Because of its oscillating nature, it works well in both trending and ranging markets.
Best Settings for the Real Woodie CCI Indicator
The default setting is 14, which calculates recent price changes to determine momentum.
However, traders may adjust the period depending on strategy:
Lower periods (6–10) → More signals, more volatility
Default period (14) → Balanced approach
Higher periods (20–30) → Fewer but more reliable signals
There is no universal “best setting”—it depends on trading style, market conditions, and risk appetite.
Why Traders Prefer the Real Woodie CCI
Easy to read
Works across all timeframes
Identifies market cycles
Helps with trend confirmation
Ideal for both beginners and advanced traders
Because the indicator is straightforward and does not clutter the chart, it fits well into any trading strategy—from Scalping to swing trading.
Conclusion
The Real Woodie CCI indicator offers a simple yet powerful way to measure momentum and determine BUY or SELL opportunities. It plots a moving average line and a signal line that help identify overbought and oversold conditions efficiently. Best of all, the indicator is free to download and easy to integrate into any MT4 strategy.
For more professional indicators, tools, and guides, visit IndicatorForest.com and elevate your trading performance.
FAQ
Published:
Nov 23, 2025 00:41 AM
Category: