Mastering Market Momentum with the R Trend V1 Indicator
In the complex landscape of financial trading, the ability to accurately distinguish between a true trending market and mere price noise is the hallmark of a successful strategy. Many standard oscillators provide data that is too "choppy" for lower timeframes, leading to costly false signals. The R Trend V1 indicator is a sophisticated trend-following tool designed to bring clarity to your charts by visualizing momentum through a multi-layered, color-coded sub-window system.
What is the R Trend V1 Indicator?
The R Trend V1 is a momentum-based technical indicator that operates as a smoothed oscillator. It analyzes Price Action over a specific look-back period to determine the dominance of buyers or sellers. Unlike a single-line moving average, the R Trend V1 utilizes multiple interacting lines—typically a fast-response line and a slower, smoothed signal line—to identify the exact moment a trend gains or loses conviction.
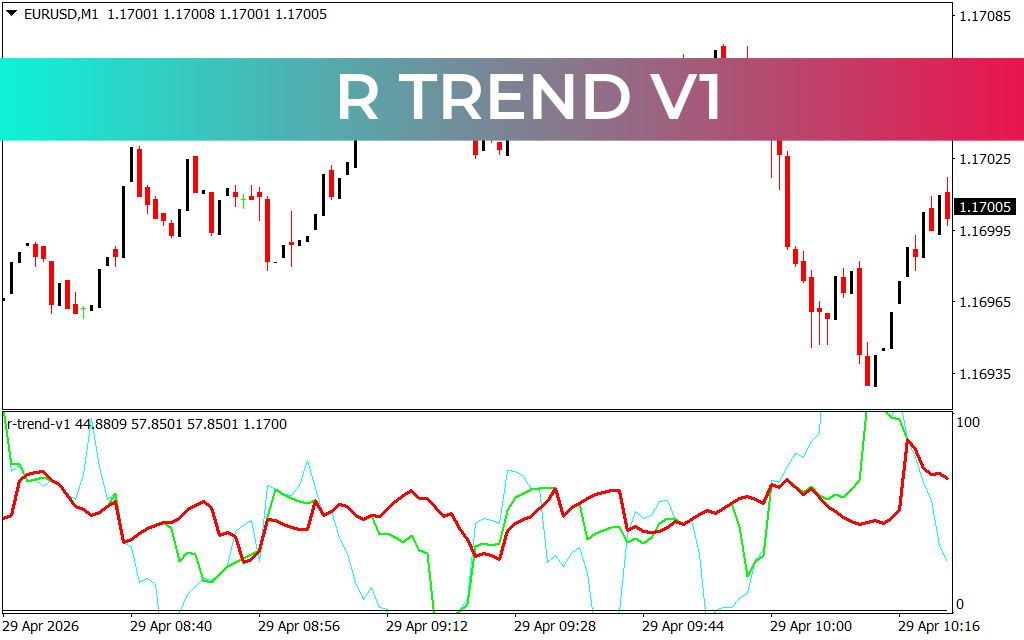
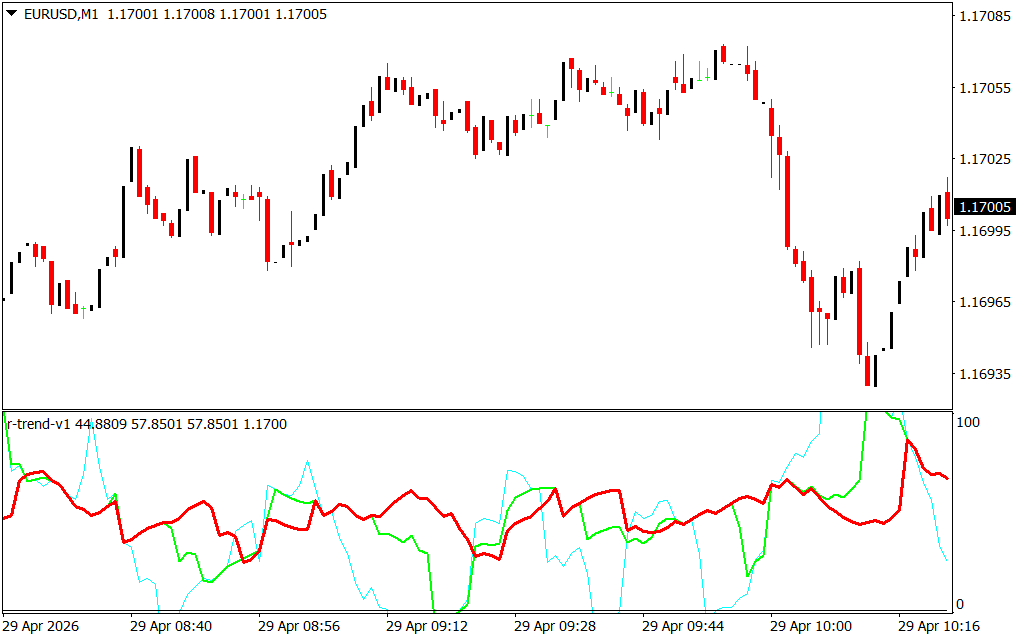
As seen on the M1 timeframe, the indicator creates a visual "web" of momentum. The primary lines change color (often transitioning between green and red) to reflect the real-time shift in market power, providing an intuitive guide for traders who need to make split-second decisions.
Key Features of the V1 System
- Multi-Layered Analysis: By using more than one momentum calculation, the R Trend V1 identifies "confluence" within its own sub-window. When the fast line (cyan) and the thicker trend lines (green/red) align, the probability of a successful trade increases.
- Visual Noise Filtering: The V1 algorithm is engineered to ignore minor price fluctuations. This ensures that the indicator stays green during bullish pullbacks and red during bearish retracements, helping traders avoid the "shake-out" traps common in volatile sessions.
- Instant Sentiment Shifts: The vertical distance between the lines represents the intensity of the trend. Wide gaps signify high momentum, while converging lines warn of an impending consolidation or reversal.
Strategic Trading Applications
The R Trend V1 is a versatile tool that enhances various trading styles, from Scalping to swing trading:
- The Trend Cross: The most potent signal occurs when the fast-response line crosses over the thicker trend lines. A cross from below into a green-colored zone confirms a bullish entry, while a cross from above into a red-colored zone signals a bearish entry.
- Zero-Line Equilibrium: The indicator often oscillates around a central point. When the R Trend V1 stays consistently above the 50.00 or 0.00 median, it confirms a dominant bullish environment, suggesting that traders should only look for "Buy" setups.
- Divergence Detection: If price makes a new high but the R Trend V1 lines fail to reach a new peak, it signals "momentum exhaustion." This leading indicator allows traders to exit positions early before the market reverses.
Conclusion
The R Trend V1 indicator is an essential asset for any trader who values visual precision and data-driven entries. By stripping away market noise and highlighting the core momentum of an asset, it provides the structural confidence needed to navigate modern markets. Whether you are scalping the M1 or analyzing the H1, the R Trend V1 offers a professional edge in trend identification.
3 Downloads
Last Update:
Apr 29, 2026 15:48 PM
Published:
Jan 30, 2026 22:53 PM
Category: