Master Market Volume with the Gadi OBV v2 Custom Range Indicator
In the competitive world of Forex trading, Price Action is often considered the primary signal. However, professional traders know that price alone can be misleading without the confirmation of volume. The Gadi OBV v2 Custom Range Indicator is a sophisticated technical tool for MetaTrader designed to uncover the hidden strength of market trends by analyzing On-Balance Volume (OBV) within specific, user-defined parameters.
The Power of Cumulative Volume
The On-Balance Volume (OBV) is a Momentum Indicator that uses volume flow to predict changes in stock or currency price. Joseph Granville, the creator of OBV, believed that volume is the "steam" that drives the price engine. The Gadi OBV v2 version enhances this classic concept by allowing traders to filter and smooth volume data, providing a much clearer picture of whether institutional "smart money" is accumulating or distributing a position.
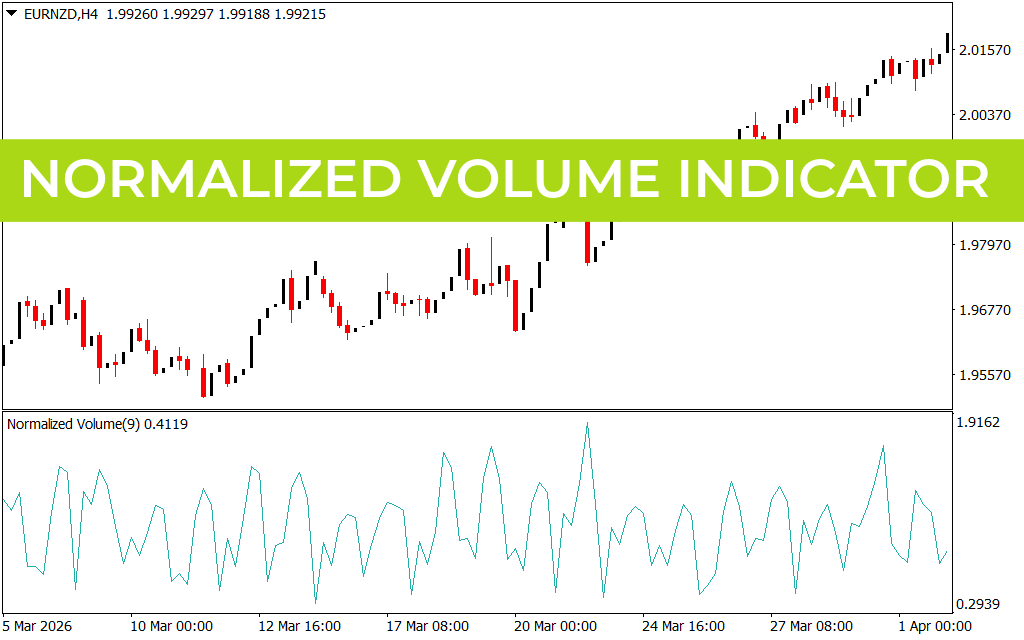
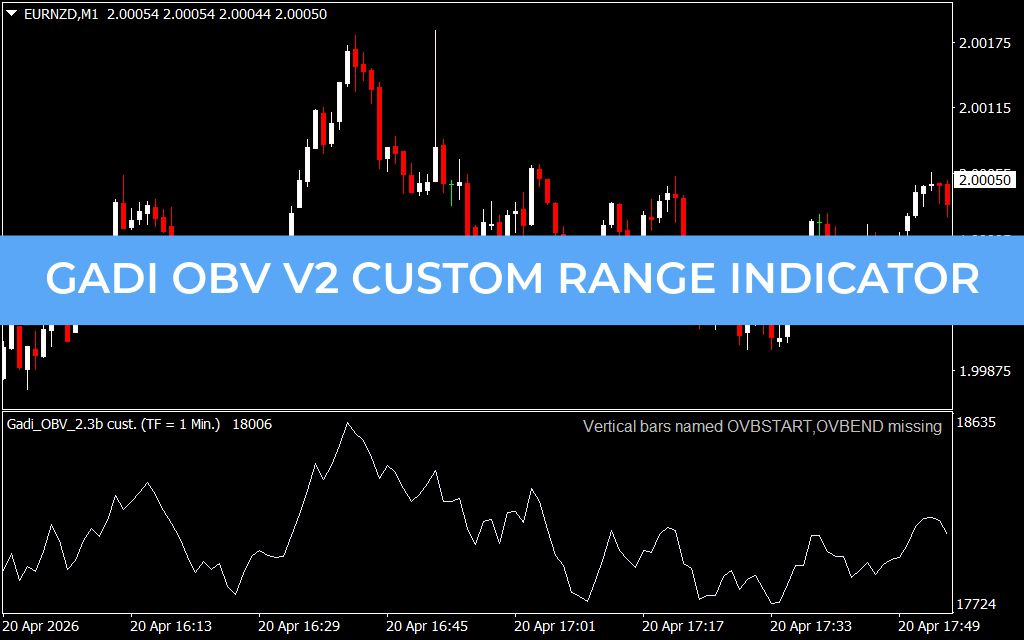
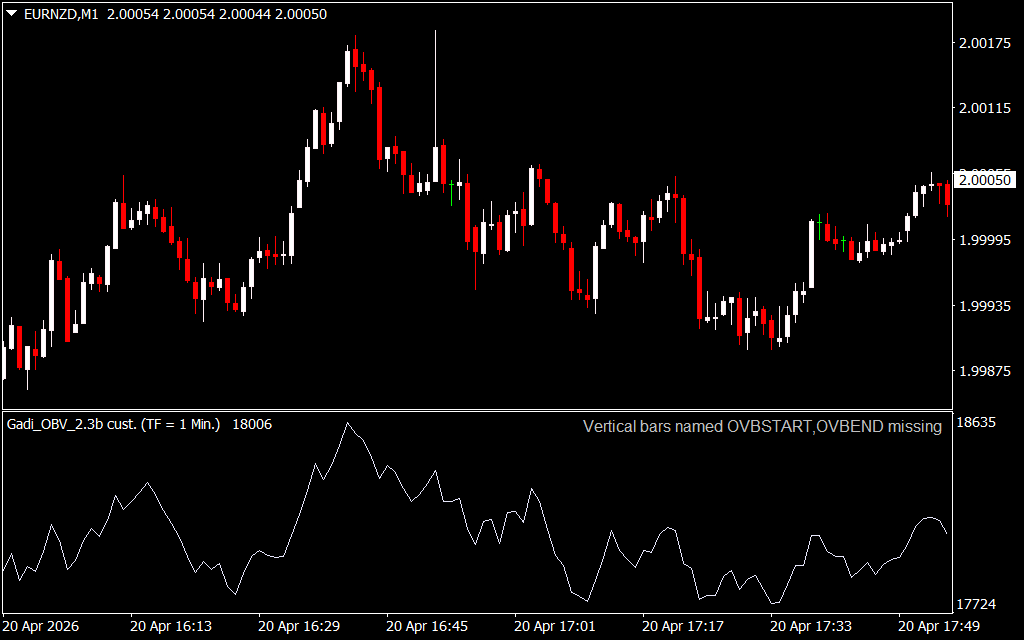
As demonstrated on the EURNZD M1 chart, the indicator operates in a dedicated sub-window:
- The OBV Line: Unlike raw volume bars which can be erratic, the Gadi OBV plots a continuous line that represents the cumulative total of volume. When the current candle closes higher than the previous, that volume is added; when it closes lower, it is subtracted.
- Custom Timeframe Integration: This specific version allows for multi-timeframe analysis (e.g., viewing 1-minute volume trends while on a higher chart), ensuring that short-term noise does not obscure long-term conviction.
- Visual Clarity: By smoothing out sharp spikes, the indicator helps traders identify "volume breakouts" that often precede a significant move in price.
Strategic Implementation and Divergence
The Gadi OBV v2 is a premier tool for validating the quality of a trend. On fast-moving pairs like EURNZD, it serves as a critical filter for avoiding false breakouts.
- Trend Confirmation: In a healthy uptrend, the OBV line should make a series of higher highs and higher lows alongside the price. If the OBV is rising while the price is climbing, it confirms that the trend is supported by increasing participation and is likely to continue.
- The Divergence Signal: This is the most powerful signal the Gadi OBV provides. If the price of EURNZD makes a new high but the OBV line fails to do so (Bearish Divergence), it reveals that the move is "hollow" and likely to reverse. Conversely, if price makes a new low but OBV stays higher (Bullish Divergence), a reversal to the upside is often imminent.
- Breakout Validation: When price is consolidating in a range, watch the Gadi OBV. If the OBV breaks out of its own resistance level before the price does, it provides a high-probability "early bird" signal to enter the trade.
Why Your MetaTrader Setup Needs This Tool
The primary benefit of the Gadi OBV v2 is its ability to quantify market pressure. It tells you if the "big players" are actually behind a move or if it is merely retail-driven volatility. By removing the guesswork from volume analysis, this indicator provides the objective data required for professional-grade decision-making.
Whether you are a scalper looking for rapid momentum shifts or a trend follower seeking to maximize your profit-taking, the Gadi OBV v2 Custom Range Indicator offers the structural clarity needed for consistent results. It transforms your trading terminal into a comprehensive volume analysis center, giving you the edge to stay ahead of the curve in today's liquid markets.
1 Download
Last Update:
Apr 20, 2026 22:47 PM
Published:
Feb 03, 2026 13:18 PM
Category: