Master Trend Sustainability with the Dorsey Inertia Indicator
In the complex world of technical analysis, distinguishing between a temporary price spike and a long-term trend is the ultimate challenge. While momentum oscillators like the RSI or Stochastic are excellent for identifying overbought conditions, they often fail to capture the "energy" behind a move. The Dorsey Inertia Indicator is a sophisticated technical tool designed to solve this problem by measuring the underlying trend persistence and market stability.
What is the Dorsey Inertia Indicator?
Developed by Thomas Dorsey, the Inertia Indicator is a derivation of the Relative Vigor Index (RVI) smoothed by a Least Squares Moving Average (LSMA). The core philosophy behind the indicator is that a trend in motion tends to stay in motion. It doesn't just look at where the price is; it looks at the inertia—the physical-like property of a trend to resist change.
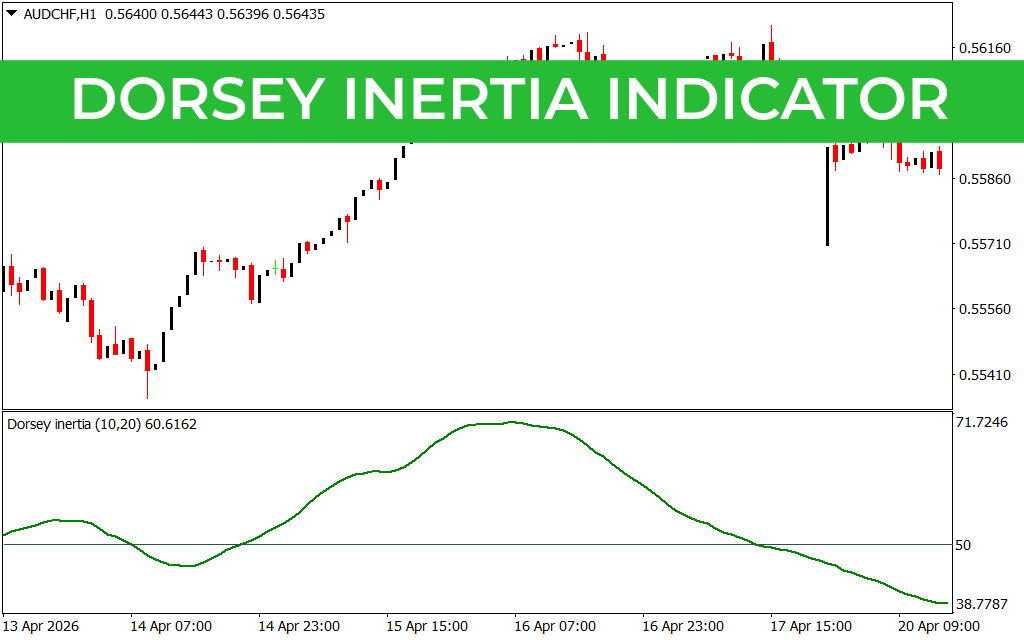
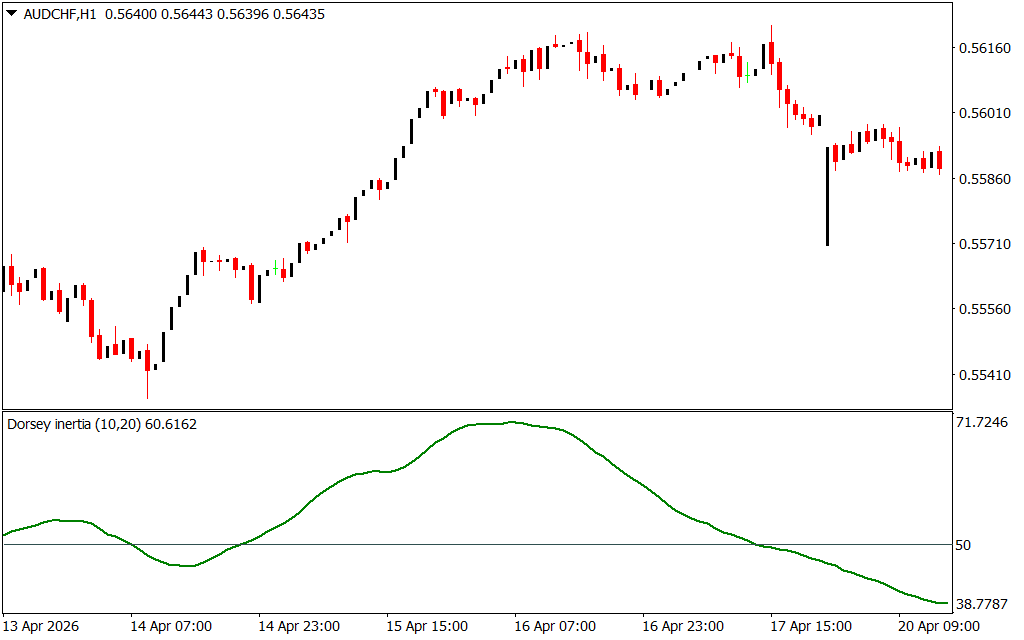
As shown in the provided AUD/CHF H1 chart, the indicator appears as a smooth, oscillating green line centered around a 50-level midline:
- Above 50: Indicates positive inertia. The trend is stable, and the bulls are in control.
- Below 50: Indicates negative inertia. The downward pressure is consistent, and the bears dominate.
Why Inertia is Better Than Momentum
Traditional momentum indicators often flip-flop during periods of minor volatility, leading to "whipsaw" trades. The Dorsey Inertia Indicator filters out this noise. Because it uses a linear regression-based smoothing (LSMA), it only rises when the market demonstrates a statistically significant directional move.
- Trend Confirmation: It acts as a final "filter" for your entries. If your strategy gives a buy signal but the Inertia line is still below 50, it suggests the trend hasn't yet gathered enough "mass" to be reliable.
- Identifying Exhaustion: When the green line reaches extreme highs (above 70) or lows (below 30) and starts to curve back toward the 50-line, it signals that the trend’s inertia is fading, providing an early warning for exit.
- Market Stability: A flat line near 50 indicates a market without direction, a clear sign for trend traders to stay on the sidelines.
Trading Strategy: The Midline Crossover
The most robust way to utilize this tool is the Midline Crossover Strategy.
- The Long Entry: Look for the green Inertia line to cross from below 50 to above 50. This confirms that the market has transitioned from a bearish or neutral state into a high-probability bullish trend.
- The Short Entry: Conversely, a cross from above 50 to below 50 signals that bearish inertia is taking over.
On the H1 chart provided, notice how the Inertia indicator identifies the broad "hump" of Price Action. While the candles show individual pullbacks, the Inertia line remains steadily above 50 during the major uptrend, allowing traders to stay in the position longer and maximize profits.
Conclusion
The Dorsey Inertia Indicator is a vital asset for any MetaTrader 4 (MT4) user who wants to trade with the "wind at their back." By quantifying the stability of a trend, it removes the guesswork from technical analysis and helps you focus on trades with the highest probability of continuation.
2 Downloads
Last Update:
Apr 27, 2026 21:57 PM
Published:
Feb 01, 2026 12:49 PM
Category: