The Price Patterns Indicator is a powerful tool for forex traders who want to capitalize on Price Action patterns. The forex market constantly forms shapes and patterns as a result of market forces interacting. These patterns, historically tested, often provide a statistical edge for traders looking to enter or exit trades.
Identifying these patterns manually can be challenging, especially for beginners. The Price Patterns Indicator automates this process by scanning the chart, labeling patterns, and highlighting potential trading opportunities. This allows traders to act quickly and confidently, reducing guesswork in trading.
How the Price Patterns Indicator Works
The Price Patterns Indicator can be applied to any currency pair and timeframe. However, it is most effective on longer timeframes such as 4-hour, daily, or weekly charts, as patterns formed on these frames tend to be stronger and more reliable.
The indicator identifies key patterns including:
Triangles: Signals Trend Continuation in the direction of the breakout.
Head and Shoulders: Indicates potential trend reversals.
Triple Bottoms or Tops: Suggests trend reversals at support or resistance zones.
Rising and Falling Wedges: Can indicate either continuation or reversal depending on the breakout direction.
Trading Examples
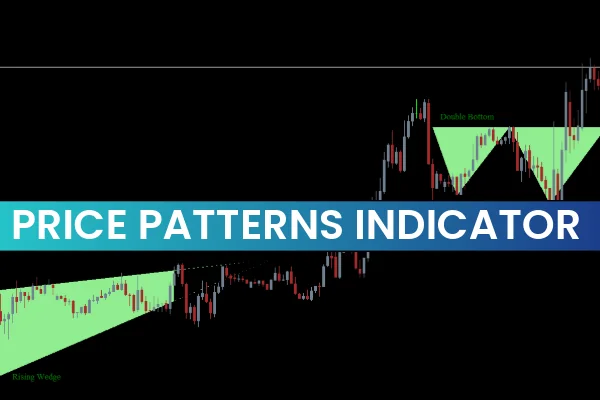
For example, consider the USD/JPY chart. A rising wedge formed on the chart is shaded green by the indicator. This pattern signals trend continuation, and traders can take advantage by entering a buy position at the breakout point.
Similarly, a head-and-shoulders pattern is shaded light coral. This pattern is a classic signal of a potential bearish reversal. Traders should consider entering a sell position while placing a stop loss above the head (highest peak) for risk management.
By clearly highlighting patterns, the indicator eliminates the need for traders to memorize every price action pattern. You can simply follow the visual signals and make informed trading decisions.
Benefits of the Price Patterns Indicator
Automatically detects Trend Reversal and continuation patterns
Works for all currency pairs and timeframes
Saves time and effort in manual chart analysis
Ideal for both beginner and experienced traders
Complements existing trading strategies and technical analysis
Conclusion
The Price Patterns Indicator is an essential tool for price action traders looking to simplify their analysis and make profitable trades. It is easy to use, time-saving, and works well on longer timeframes for more reliable signals. Incorporate this indicator into your trading strategy to efficiently identify trade opportunities, whether buying in uptrends or selling during reversals.
FAQ
1 Download
Published:
Nov 27, 2025 09:39 AM
Category: