Master Strategic Reversals with the FIB SR Indicator
In the complex ecosystem of Forex trading, identifying where the market will pause, reverse, or accelerate is the key to sustainable profitability. While many traders rely on basic horizontal lines, the most successful market participants use mathematical ratios to find "hidden" levels of Supply And Demand. The FIB SR Indicator is a premium technical tool designed to bridge the gap between Fibonacci theory and traditional Support And Resistance (SR) levels, providing a clear roadmap for intraday traders.
Download FIB SR Indicator for free. Identify high-confluence Fibonacci zones and automated support and resistance levels for precision MT4 trading.
What is the FIB SR Indicator?
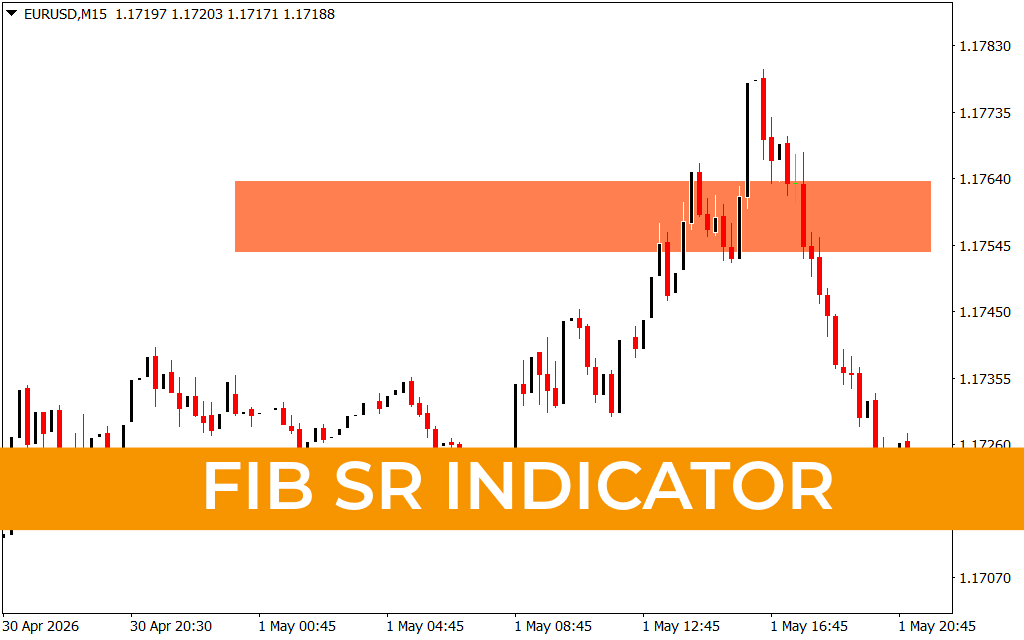
The FIB SR Indicator—as demonstrated in the EUR/USD M15 chart—is an automated technical study that identifies and highlights high-confluence price zones. Unlike manual Fibonacci retracement tools that require the trader to correctly identify swing highs and lows, this indicator algorithmically scans Price Action to plot significant zones of interest. These zones, often displayed as shaded rectangles (like the orange supply zone shown in the image), represent areas where Fibonacci retracement levels align perfectly with historical price pivots.
The Power of Confluence
The primary reason the FIB SR Indicator is a favorite among professional MT4 and MT5 traders is the concept of confluence. When a 61.8% Fibonacci level coincides with a previous structural resistance, the probability of a price rejection increases exponentially.
In the provided chart, you can clearly see the indicator highlighting a major supply zone between 1.17545 and 1.17640. As the EUR/USD rallied into this orange box, the FIB SR Indicator signaled that the move was overextended. The subsequent sharp rejection and bearish trend confirm the indicator's ability to spot "Smart Money" entry points before the move happens.
Key Features of FIB SR
- Automated Zone Detection: No more second-guessing your Fibonacci anchor points. The indicator does the heavy lifting, plotting fresh zones as Market Structure evolves.
- Intraday Precision: Optimized for the 15-minute (M15) and 1-hour (H1) timeframes, making it the perfect tool for scalpers and day traders looking for quick, high-probability setups.
- Visual Clarity: By shading the entire area of support or resistance, the indicator accounts for market "noise," giving you a zone to watch rather than a single, easily broken line.
- Risk Management: These zones provide natural locations for stop-loss placement. A trade taken at the edge of a FIB SR zone allows for a tight stop just outside the box, offering excellent risk-to-reward ratios.
Strategy: Trading the Rejection
The most effective way to trade with the FIB SR Indicator is to wait for price action confirmation within the highlighted zones. Look for bearish candlestick patterns (like pin bars or engulfing candles) when the price enters a supply zone, or bullish signals within a demand zone. By combining the mathematical accuracy of Fibonacci with the visual logic of SR zones, you can filter out weak signals and focus on the trades that truly matter.
2 Downloads
Last Update:
May 03, 2026 01:01 AM
Published:
Jan 28, 2026 22:38 PM
Category: