Master Market Structure with the Pipholic SR Indicator
In the world of professional trading, identifying where price is likely to stall or reverse is the foundation of a profitable strategy. While many traders struggle with the subjectivity of manual chart drawing, elite Price Action traders use technical tools to define market boundaries with surgical precision. The Pipholic SR indicator for MetaTrader 4 is a premier Support And Resistance tool designed to automatically map out the "zones of interest" that dictate price movement.
What is the Pipholic SR Indicator?
The Pipholic SR is a structural analysis indicator that identifies critical Supply And Demand levels in real-time. By analyzing price peaks and troughs, the indicator plots horizontal levels that represent significant historical barriers. These levels act as psychological floors and ceilings where institutional orders are often clustered.
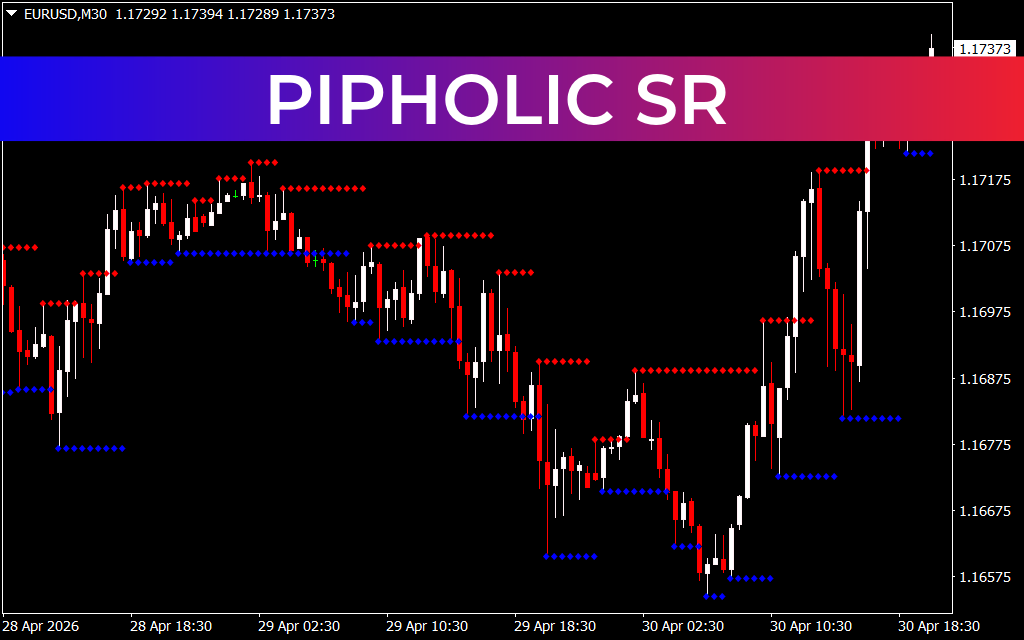
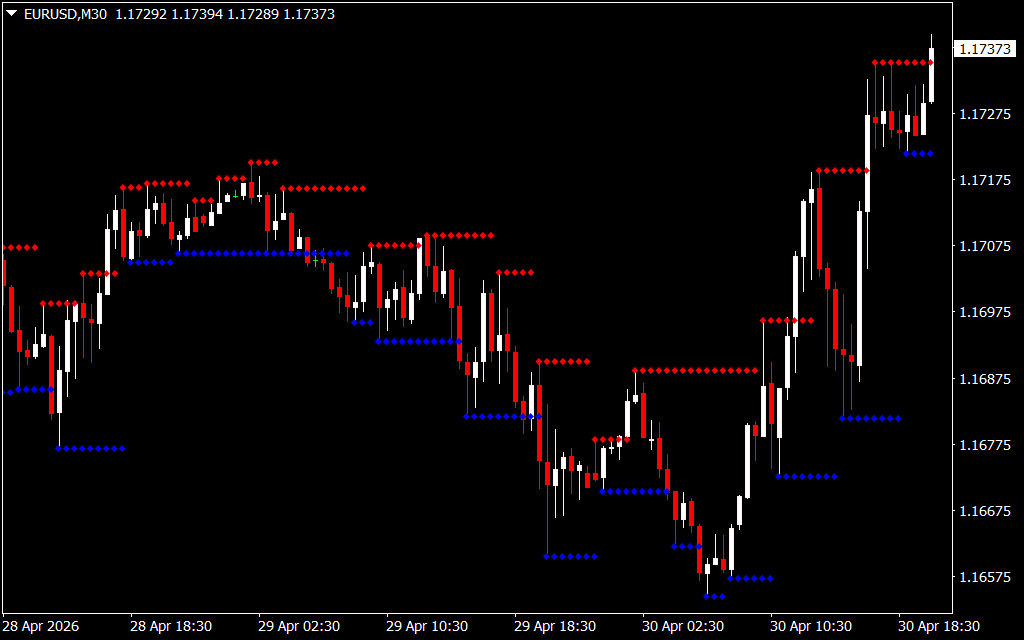
As demonstrated in the file EURUSDM30.png, the indicator uses a clean, color-coded system to separate market forces. Red diamond lines represent resistance levels (Supply), where sellers have historically overwhelmed buyers. Conversely, blue diamond lines represent support levels (Demand), where buying pressure has successfully defended a price floor. On the 30-minute chart shown, these levels provide a clear roadmap for intraday price fluctuations.
Key Features and Strategic Advantages
- Dynamic Level Generation: Unlike static pivot points, Pipholic SR updates based on current price action, ensuring you are always trading with the most relevant structural data.
- Visual Clarity: By using dotted diamond lines, the indicator avoids cluttering your charts with thick blocks, allowing you to maintain focus on candlestick patterns and price flow.
- Objective Analysis: It removes the guesswork from technical analysis. Instead of wondering if a level is "valid," the indicator provides mathematically confirmed zones where price has reacted before.
- Multi-Timeframe Reliability: Whether you are Scalping on the M5 or swing trading the H4, the structural logic remains consistent, providing high-probability zones across all assets.
How to Trade Using Pipholic SR
To maximize the effectiveness of this tool, traders should integrate these levels into a comprehensive execution plan:
- Range Trading: In a sideways market, traders can look to sell near the red resistance lines and buy near the blue support lines, using the levels as targets for take-profits.
- Break and Retest: When price breaks through a red resistance line, that level often flips to become new support. Watching for a "retest" of the diamond line provides a high-probability entry for Trend Continuation.
- Confluence with Price Action: The strongest signals occur when a Pipholic SR level aligns with a candlestick reversal pattern, such as a Pin Bar or an Engulfing candle, right at the blue or red diamonds.
Conclusion
The Pipholic SR indicator is an essential asset for any MT4 user who values structural integrity and chart clarity. By highlighting the hidden floors and ceilings of the market, it empowers you to enter trades with higher confidence and manage risk with professional precision. Take the guesswork out of your technical analysis and start trading the market's true levels today.rex trading today.
1 Download
Last Update:
Apr 30, 2026 23:59 PM
Published:
Jan 30, 2026 02:38 AM
Category: