Strategic Price Levels with the PB Auto Pivots Indicator
In the world of intraday trading, having a clear map of potential turning points is the difference between a winning streak and a series of missed opportunities. Professional traders have long relied on Pivot Points to determine market sentiment and identify key areas of Support And Resistance. The PB Auto Pivots indicator automates this complex calculation, providing a real-time, institutional-grade roadmap directly on your MT4 or MT5 charts.
The Power of Automated Pivot Points
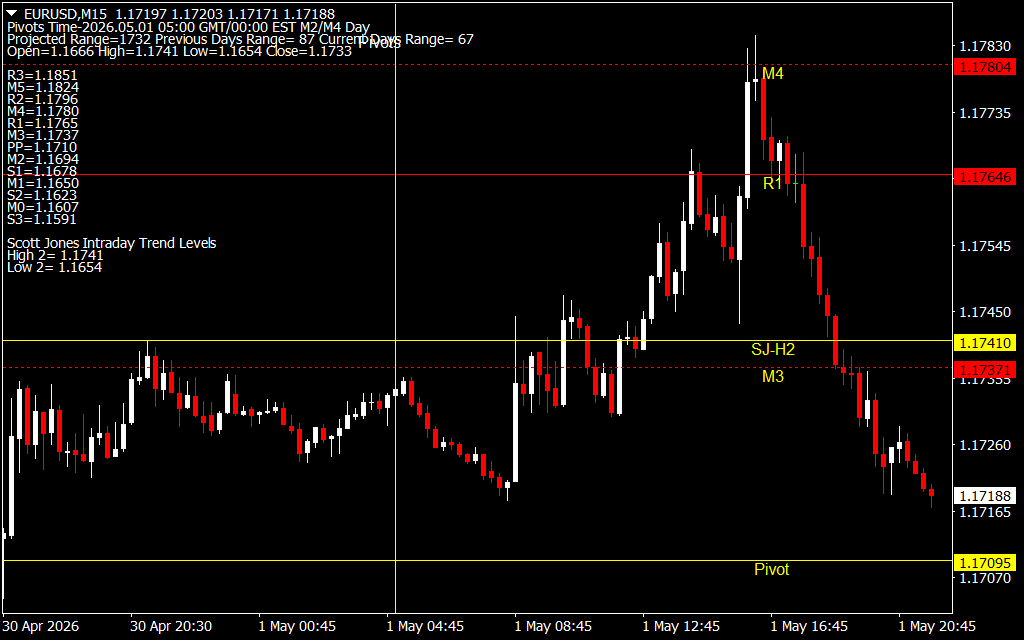
Pivot points are predictive indicators based on the previous day's high, low, and close prices. They are considered "objective" levels because thousands of traders and institutional algorithms watch the exact same prices. The PB Auto Pivots indicator takes this a step further by plotting several critical levels, including the central Pivot Point (PP), Resistance levels (R1, R2, R3), and Support levels (S1, S2, S3), alongside mid-point levels like M1, M2, and M3.
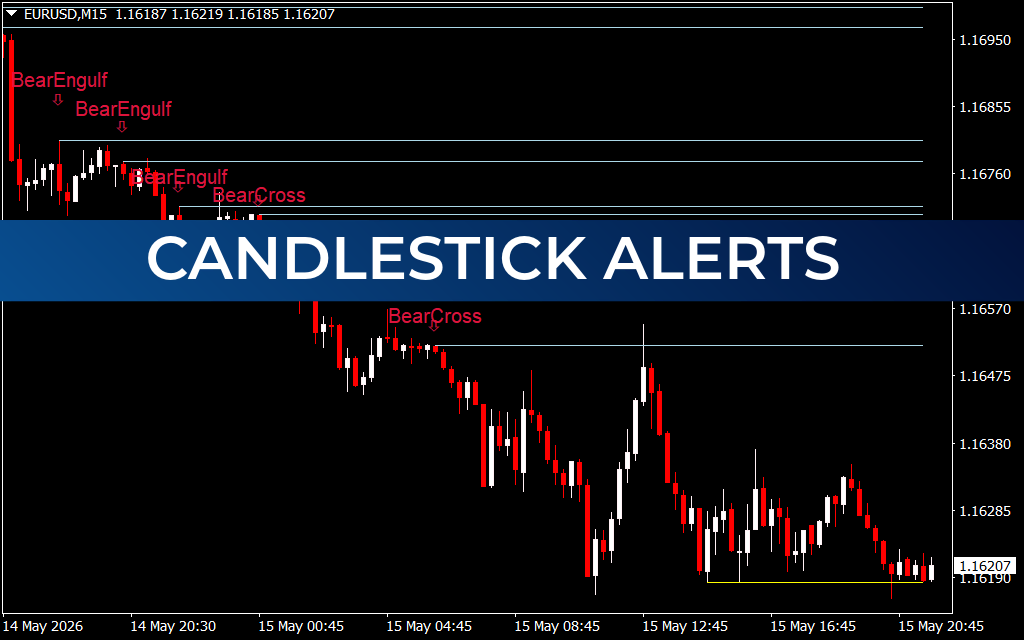
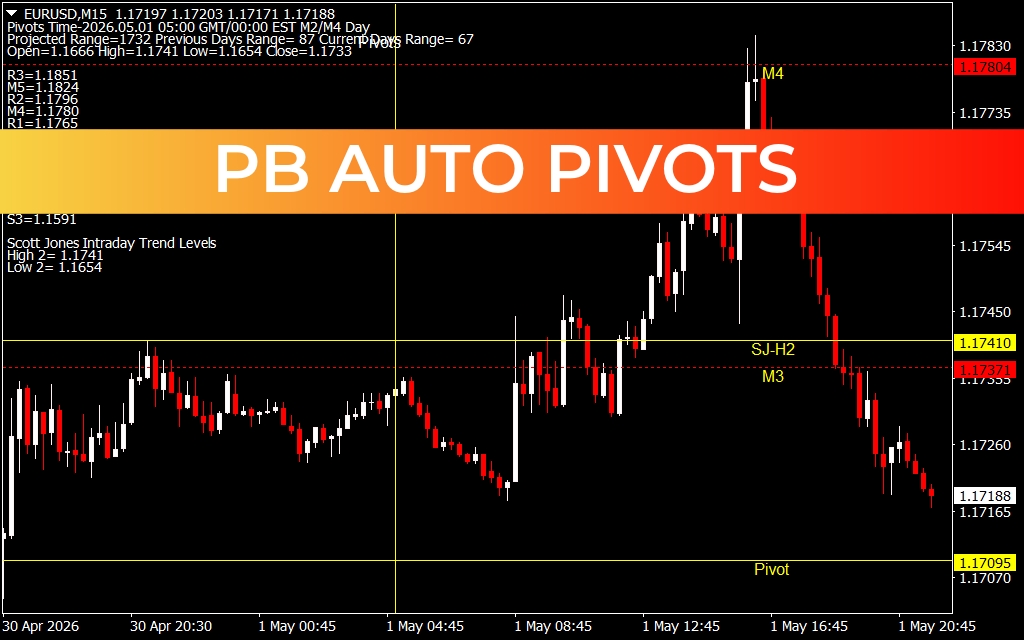
As seen in the EUR/USD M15 chart, the indicator provides a comprehensive breakdown of the day's projected range. These lines act as psychological barriers where price is likely to pause, reverse, or accelerate. By having these levels automatically calculated and plotted, you eliminate manual errors and can focus entirely on executing your strategy.
Key Features and Advantages
- Dynamic Intraday Levels: The indicator identifies "Scott Jones Intraday Trend Levels," providing high-precision targets like the SJ-H2 and M4 levels seen in the Price Action.
- Institutional Confluence: Because pivots are calculated using standard mathematical formulas, they often align with where major banks and hedge funds place their orders.
- Visual Efficiency: The levels are clearly labeled on the right-hand side of the chart with color-coded lines, making it easy to distinguish between major resistance (red) and support zones.
- Range Projection: It includes data on the projected range versus the current day's range, helping traders understand if the market is overextended or has more room to move.
Trading Strategies with PB Auto Pivots
The most effective way to trade with PB Auto Pivots is to look for price rejection or breakouts at the plotted lines. For example, if the price approaches the R1 or M4 level and shows a bearish candlestick reversal pattern, it serves as a high-probability "Sell" signal with a clear target at the central Pivot line.
Conversely, in a strong trending market, a "Break and Retest" of a pivot level can provide a safe entry point. If the price breaks above the Pivot Point and then returns to bounce off it, the line has flipped from resistance to support, confirming a bullish continuation. These levels also provide the most logical spots for placing Stop Losses and Take Profit orders, ensuring a mathematically sound risk-to-reward ratio.
Conclusion
The PB Auto Pivots indicator is an indispensable tool for day traders and scalpers who require structural clarity in the markets. By transforming raw price data into a structured grid of support and resistance, it allows you to anticipate market moves before they happen. Download this tool today to bring institutional-level precision to your technical analysis.
2 Downloads
Last Update:
May 02, 2026 14:03 PM
Published:
Jan 29, 2026 17:33 PM
Category: