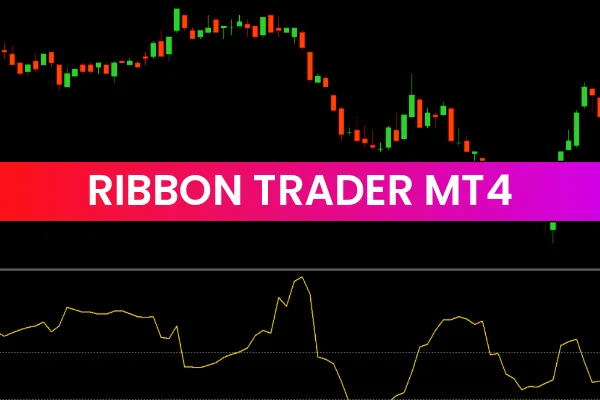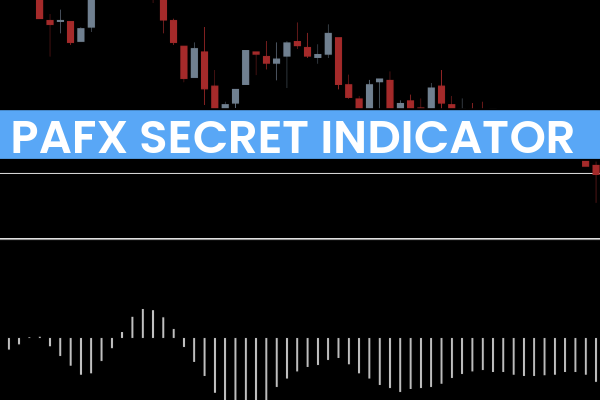
The PAFX Secret Indicator uses a histogram to display clear BUY and SELL signals for EUR/USD and other currency pairs. The histogram illustrates market momentum by plotting bars either above or below the zero line, making trend direction easy to identify.
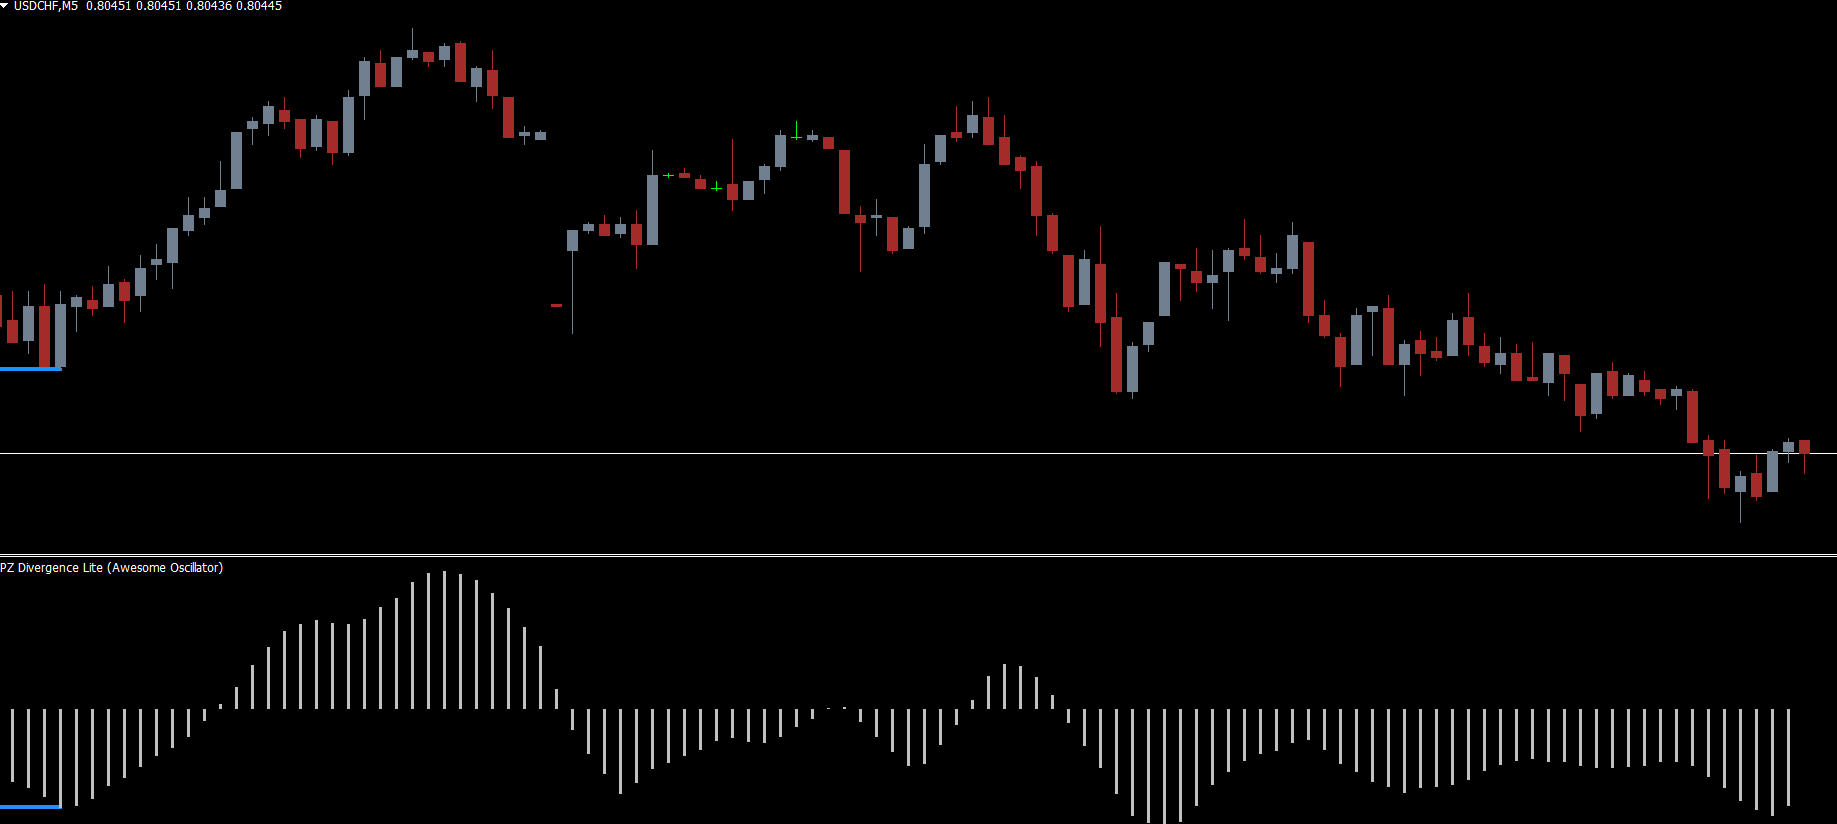
When planning a long position, the indicator must be below the zero line, with bars forming underneath it. This setup signals that the market is moving from a low point and may soon shift upward. Conversely, when preparing for a short position, the histogram should be above the zero line, showing bars forming above it and indicating potential bearish movement.
In simple terms:
If price is high and the histogram also shows a high, it may be a good time to sell.
If price is low and the histogram shows a low, traders should look for buying opportunities.
To improve accuracy, traders can combine the PAFX Secret Indicator with a momentum tool such as the RSI, helping confirm overbought or oversold conditions.
Conclusion
The PAFX Secret Indicator is a valuable tool for traders who want a clearer view of market momentum and directional signals. With its simple histogram-based approach, it provides reliable BUY and SELL setups across various timeframes. Best of all, you can download this indicator for free from our website.
If you’d like:
FAQ
Published:
Nov 20, 2025 23:39 PM
Category: