The indicator works on the principle of forex correlation. Currency pairs can move together (positive correlation) or move in opposite directions (negative correlation). A positive correlation means both pairs trend in the same direction, while a negative correlation indicates opposing movements. The Overlay Chart Indicator visually represents these relationships, allowing traders to spot opportunities based on correlated price movements.
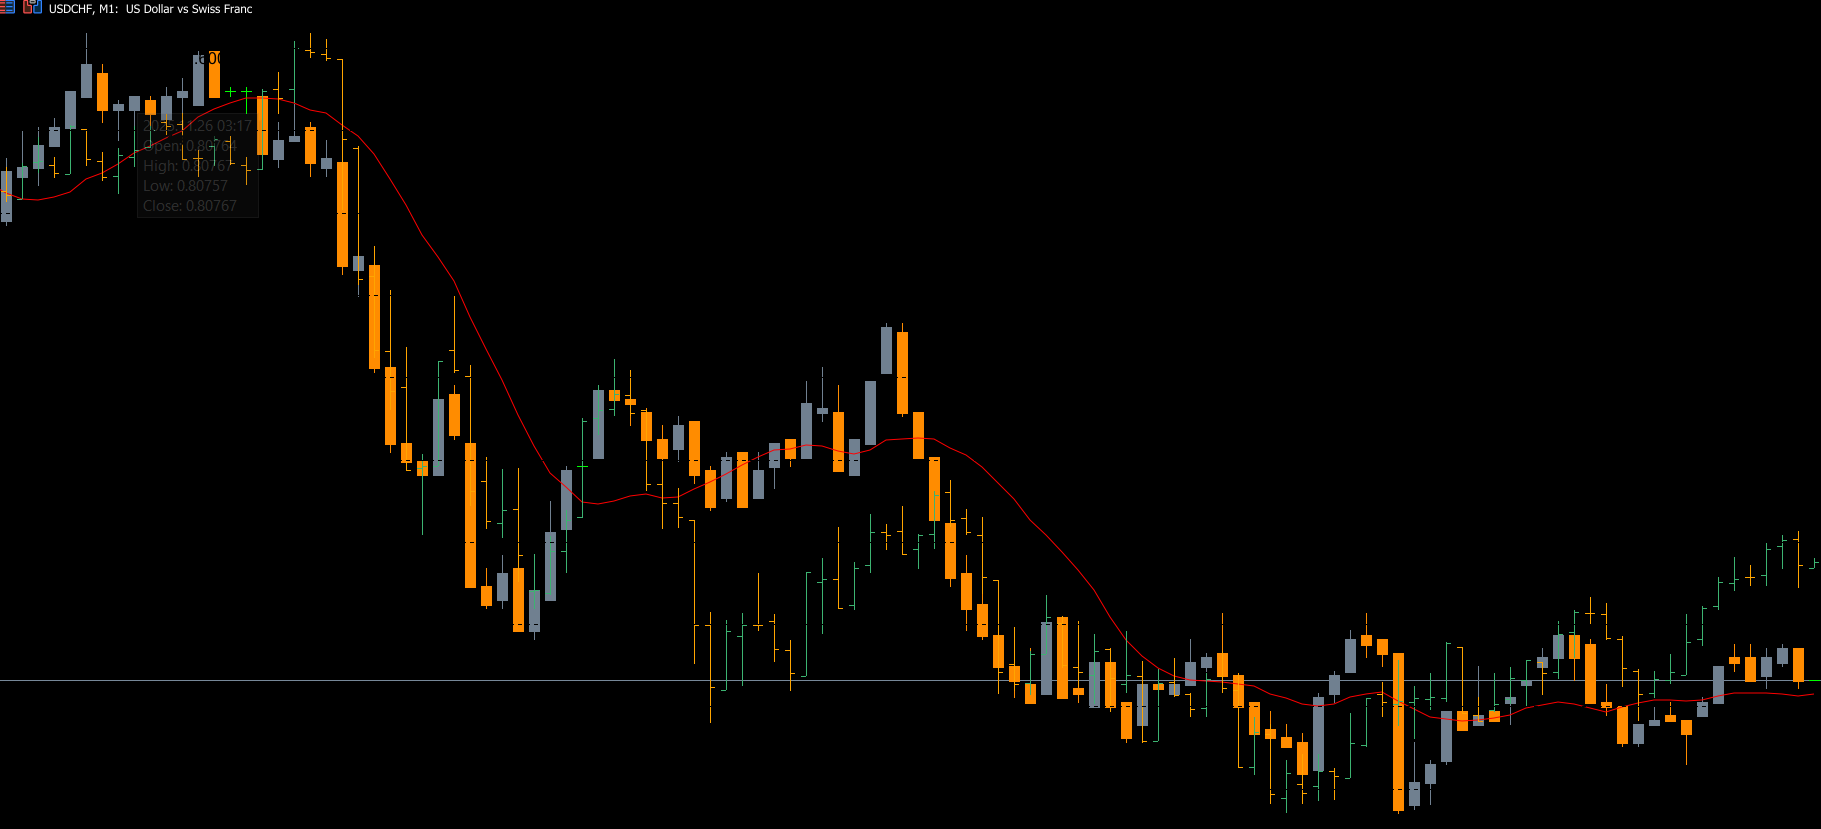
For example, if USD/CAD is the original pair and USD/JPY is overlaid, traders can observe how both pairs move in relation to each other. The overlay uses color-coded bars, such as green for bullish trends and orange for bearish trends, to make the correlation more apparent.
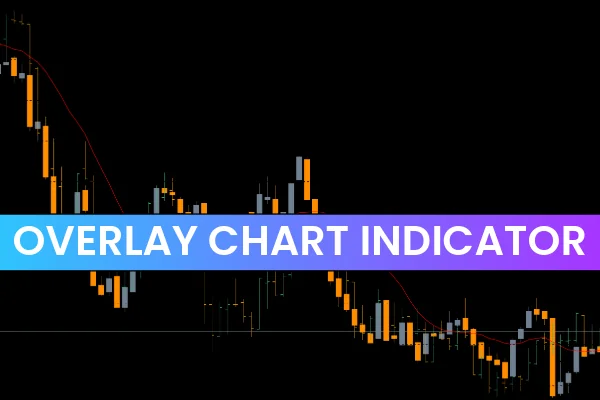
Overlay Chart Indicator BUY/SELL Signals
Traders can use the Overlay Chart Indicator for MT5 to determine potential entry and exit points:
BUY Signal: When the overlaid pair shows green bars indicating bullish momentum, traders may consider a BUY on the original pair, especially when supported by Price Action or other indicators.
SELL Signal: When the overlaid pair shows orange bars indicating bearish momentum, traders may consider a SELL on the original pair.
It is recommended to combine the Overlay Chart Indicator with other technical tools like RSI, MACD, or moving averages to confirm trade signals. This ensures accurate entry and exit points while managing risk effectively.
What Is Overlay in Technical Analysis?
Overlay analysis involves placing the price action of one asset on top of another to compare movements. Traders use overlay indicators to identify correlations, divergences, or confirmations across different instruments. This approach helps visualize how multiple markets interact and can reveal trading opportunities that may not be obvious when analyzing a single pair in isolation.
What Are Overlay Indicators?
Overlay indicators are technical tools that display the price behavior of one asset over another. Unlike standard indicators that provide separate windows or oscillators, overlay indicators work directly on the price chart. Traders can analyze trends, correlations, and price patterns efficiently by observing both the original and overlaid price actions simultaneously.
Benefits of Using the Overlay Chart Indicator for MT5
Visual comparison of two currency pairs for better trade decisions
Identifies positive and negative correlations quickly
Displays highs, lows, opens, and closes for both pairs
Compatible with multiple timeframes, though longer timeframes are recommended
Supports advanced and beginner traders with easy-to-read signals
By understanding the relationship between currency pairs, traders can take advantage of correlated movements to improve trade accuracy and risk management.
Conclusion
The Overlay Chart Indicator for MT5 is a practical tool for forex traders who want to compare multiple currency pairs simultaneously. By plotting the price action of an overlaid pair on top of the original pair, traders can identify correlations and potential trade setups more effectively. For maximum efficiency, combine this indicator with other technical tools like RSI or MACD to confirm trade signals.
Download the Overlay Chart Indicator for MT5 for free and explore more indicators at IndicatorForest.com.
FAQ
34 Downloads
Published:
Nov 25, 2025 22:04 PM
Category: