Dynamic Volatility Tracking: Mastering Markets with Voltychannel
In the high-stakes arena of Forex trading, price action is rarely a straight line. Volatility acts as the "heartbeat" of the market, expanding and contracting as economic data and institutional sentiment shift. To navigate these changes, traders need more than static Support And Resistance lines—they need a dynamic framework. The Voltychannel indicator for MetaTrader is a premier technical tool designed to map market boundaries based on real-time volatility, providing clear signals for Trend Continuation and potential reversals.
What is the Voltychannel Indicator?
Voltychannel is a trend-following volatility envelope that identifies the "extremes" of price movement. Unlike traditional Bollinger Bands that use standard deviation, Voltychannel utilizes a proprietary calculation based on Average True Range (ATR) and price momentum to create a "stepped" support and resistance system.
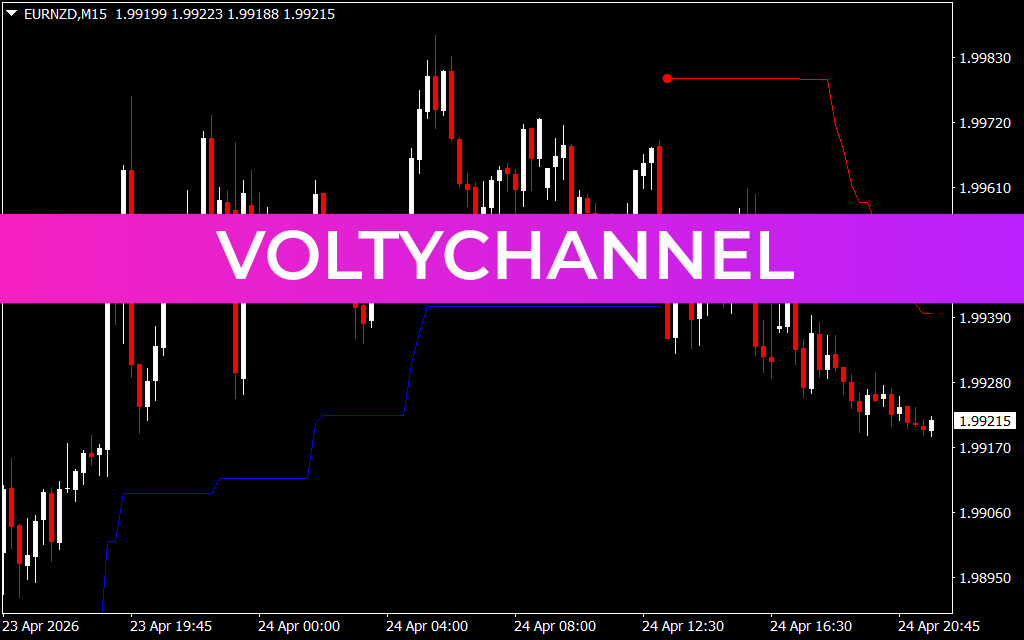
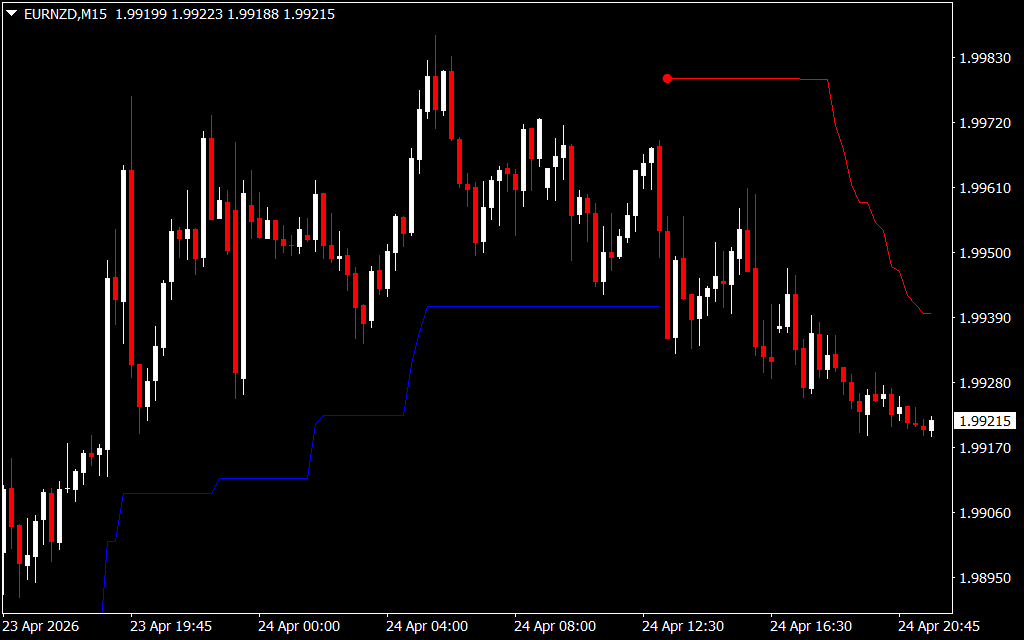
As shown in the EURNZD M15 chart, the indicator plots distinct blue and red lines on the main chart. These lines act as a dynamic ceiling and floor, adjusting their levels only when price achieves a significant momentum shift.
Visual Cues for Trend Identification
The strength of Voltychannel lies in its visual simplicity, allowing traders to categorize market states at a glance:
- The Bullish Step (Blue Line): When price is trading above the blue line, the market is in a confirmed uptrend. The "stepped" nature of the line indicates that support is rising as the market makes higher highs. In the provided chart, the blue line follows the aggressive rally from 1.98950 toward 1.99830, acting as a trailing stop for long positions.
- The Bearish Step (Red Line): When price breaks below the support and a red line appears above the candlesticks, the sentiment has flipped to bearish. The red line marks the current volatility-adjusted resistance level.
- The Trend Flip: The moment price decisively crosses the opposing line, a new trend is established. This crossover is often accompanied by a visual dot (as seen near the 1.99830 peak), signaling that the previous momentum has been exhausted and a reversal is underway.
Strategic Application on the M15 Timeframe
On the M15 chart, Voltychannel is a powerhouse for intraday Trend Following. Because it ignores minor market noise and only "steps" when significant price movement occurs, it helps traders stay in winning trades longer while avoiding premature exits.
- Trailing Stop Loss: Many professional traders use the Voltychannel lines as a mechanical trailing stop. By keeping their stop loss just behind the blue or red line, they ensure they capture the majority of a trend while protecting their capital.
- Breakout Confirmation: A candle closing on the opposite side of the channel is a high-probability entry signal. If price breaks the red line to the upside, it signals an "explosion" out of bearish territory.
- Volatility Filtering: In flat markets, the lines remain horizontal for extended periods. This tells the trader to stay out of the market until a new "step" is formed, preventing losses in "choppy" conditions.
Conclusion
Voltychannel is an essential instrument for traders who want to align themselves with the true momentum of the market. By transforming abstract volatility into concrete price levels, it removes the guesswork from trend analysis. Whether you are Scalping the M15 or swing trading the higher timeframes, Voltychannel provides the structural edge needed for consistent success.
2 Downloads
Last Update:
Apr 25, 2026 16:36 PM
Published:
Feb 02, 2026 18:07 PM
Category: