Decoding Market Sentiment: The Power of the Money Flow Index (MFI)
In the technical analysis landscape, Price Action is often described as the "what," while volume is the "why." To truly understand market dynamics, traders need a tool that synthesizes both. The Money Flow Index (MFI) Indicator is a premier momentum oscillator that does exactly that, earning its reputation as a "volume-weighted RSI." By incorporating both price and volume data, the MFI provides a more comprehensive view of buying and selling pressure than price-only oscillators.
What is the Money Flow Index?
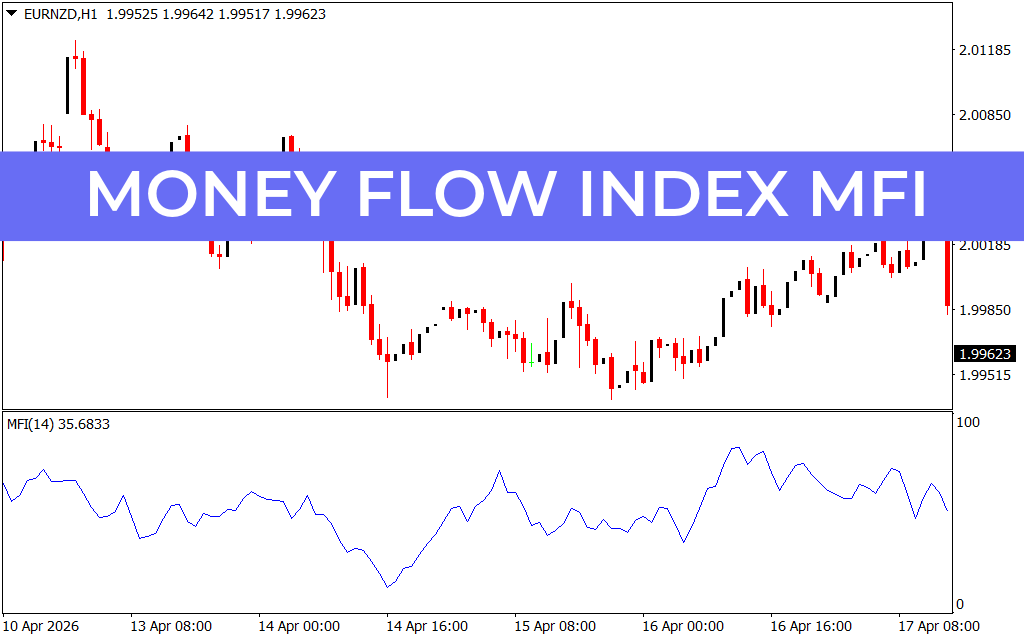
The MFI is a technical oscillator that moves between 0 and 100. It measures the "enthusiasm" of a move by looking at how much volume was traded at specific price levels. When the MFI is rising, it indicates that money is flowing into the asset (accumulation); when it is falling, money is flowing out (distribution).
As shown in the EURNZD H1 chart, the MFI appears as a single blue line in a sub-window. Its movement reflects the underlying strength of the trend, helping traders distinguish between a legitimate breakout and a low-volume "fakeout."
Why the MFI is an Essential Tool
Most traders are familiar with the Relative Strength Index (RSI), but the MFI offers a significant advantage by including volume. Volume typically precedes price; therefore, the MFI can often act as a leading indicator.
- Overbought and Oversold Extremes: Traditionally, an MFI reading above 80 is considered overbought, suggesting the market may be due for a pause or reversal. Conversely, a reading below 20 is considered oversold, indicating a potential buying opportunity.
- The Power of Divergence: One of the most reliable signals provided by the MFI is divergence. If the price makes a new high but the MFI makes a lower high, it suggests that the upward move lacks the volume support necessary to continue. This is often a precursor to a major Trend Reversal.
- Failure Swings: Much like the RSI, the MFI can exhibit failure swings. For example, if the indicator drops below 20, rallies above it, and then holds above 20 on a subsequent dip, it confirms a strong bullish shift in sentiment.
Strategic Trading with MFI
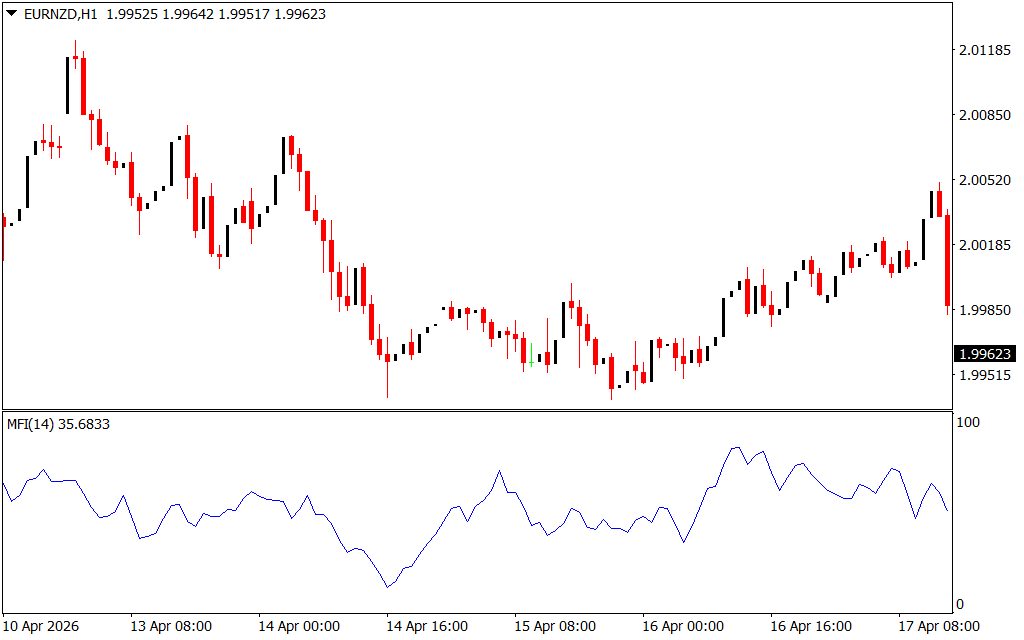
To maximize the effectiveness of the Money Flow Index, it should be paired with price action confirmation. In the provided H1 chart, notice how the MFI line fluctuates between levels 0 and 100. When the MFI reaches an extreme and then starts to turn back toward the center line (50), it provides a signal that the current momentum is shifting.
For day traders, the MFI is invaluable for confirming trend continuations. In a strong uptrend, you want to see the MFI remain consistently above the 50 level. If it dips toward 40 and then quickly hooks back up, it signals that "smart money" is stepping back in to buy the dip. By accounting for the volume behind the price, the MFI helps you trade with the conviction that you are moving with the flow of professional capital rather than against it.
1 Download
Last Update:
Apr 24, 2026 15:38 PM
Published:
Feb 03, 2026 02:18 AM
Category: