Mastering Market Volatility with the MI Bollinger Band Indicator
Volatility is one of the most important concepts for any Forex trader to understand. While standard indicators often struggle to keep up with rapid price shifts, the MI Bollinger Band Indicator offers a refined approach to mapping market range and potential breakout points. By utilizing multiple layers of standard deviation, this indicator provides a more comprehensive view of Price Action than traditional single-band systems.
What is the MI Bollinger Band Indicator?
The MI Bollinger Band is a technical analysis tool that builds upon the classic foundation of Bollinger Bands. Traditionally, these bands consist of a middle moving average and two outer lines plotted at a set standard deviation. The "MI" version expands this concept, often incorporating multiple sets of bands to create a visual "volatility channel."
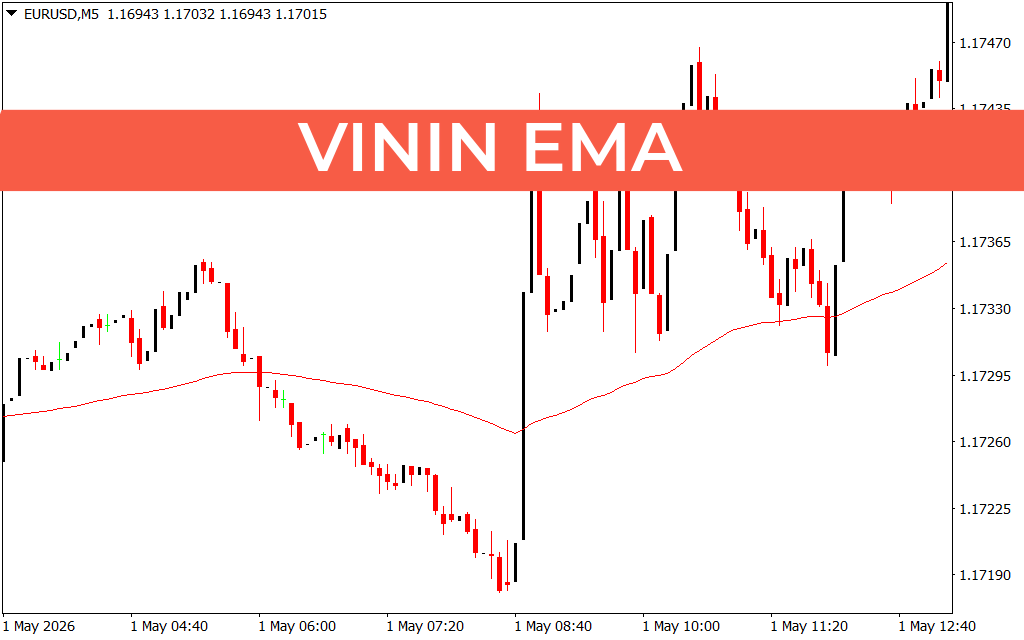
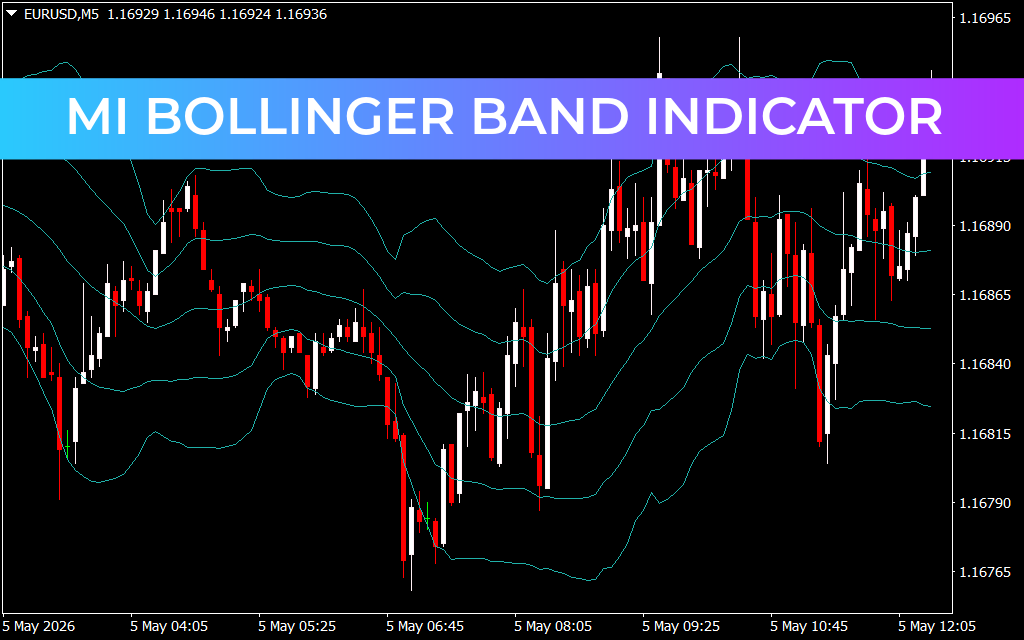
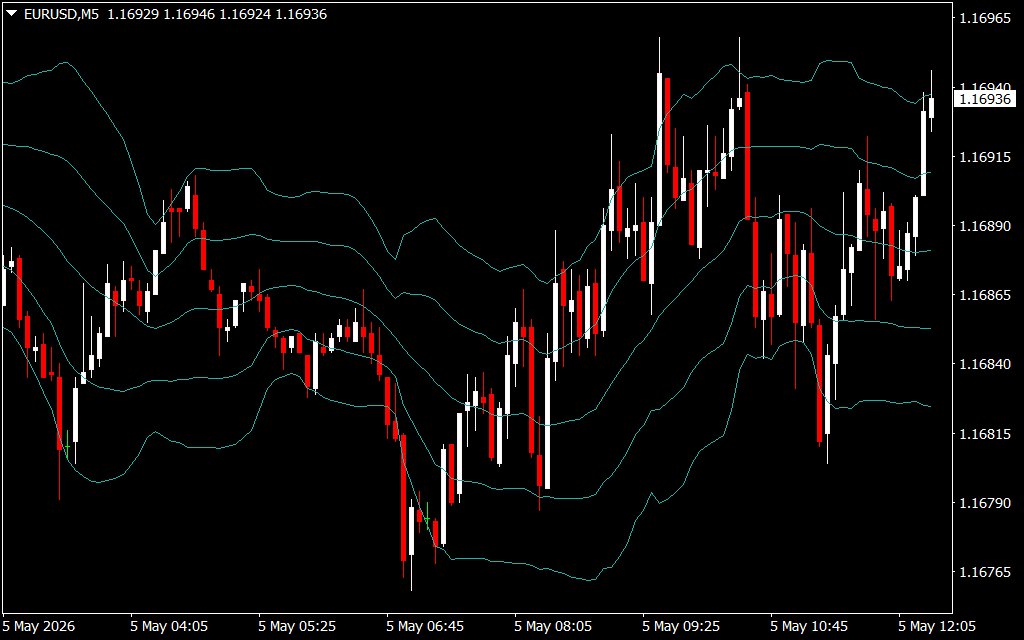
As demonstrated in the file EURUSDM5.png, this indicator creates a multi-layered envelope around the price candles. These layers help traders identify not just when the market is overextended, but the intensity of that extension. When price hugs the outermost bands, it signals extreme momentum or a potential exhaustion point, while price consolidation within the inner bands suggests a market waiting for its next big move.
Key Features and Benefits
- Multi-Level Deviation: Unlike standard bands, the MI version often displays several deviation levels (e.g., 1.0, 2.0, and 3.0). This helps in identifying "Buy" and "Sell" zones with higher precision.
- Visual Trend Identification: The slope of the bands immediately tells you the trend direction. Upward-sloping bands indicate a bullish environment, while downward-sloping bands signal bearish control.
- Volatility Squeeze Detection: One of the most powerful uses of this indicator is identifying the "Bollinger Squeeze." When the bands contract significantly, it indicates that a massive breakout is imminent.
- Dynamic Support And Resistance: The various layers act as self-adjusting support and resistance lines that move in sync with market volatility.
Trading Strategies with MI Bollinger Bands
Traders typically use the MI Bollinger Band Indicator for two main styles: Mean Reversion and Trend Following.
In a range-bound market, traders look for price to touch the outer bands and "revert" back to the middle moving average. For example, if price touches the lower outer band on the M5 chart (as seen in EURUSDM5.png) and shows a bullish rejection candle, it may be a prime opportunity for a scalp back toward the center.
Conversely, in a trending market, price will often "walk the bands." In a strong uptrend, price tends to stay between the middle line and the upper bands. If price breaks out of a "squeeze" and stays above the upper deviations, it confirms strong buying pressure, allowing traders to ride the trend with confidence.
Conclusion
The MI Bollinger Band Indicator is an essential upgrade for traders who rely on volatility-based strategies. By providing a clear, multi-layered map of price action, it reduces noise and highlights high-probability trade setups. Whether you are Scalping the M5 timeframe or looking for long-term swings, this indicator offers the clarity needed to navigate the Forex market effectively.
2 Downloads
Last Update:
May 05, 2026 15:29 PM
Published:
Jan 27, 2026 20:22 PM
Category: