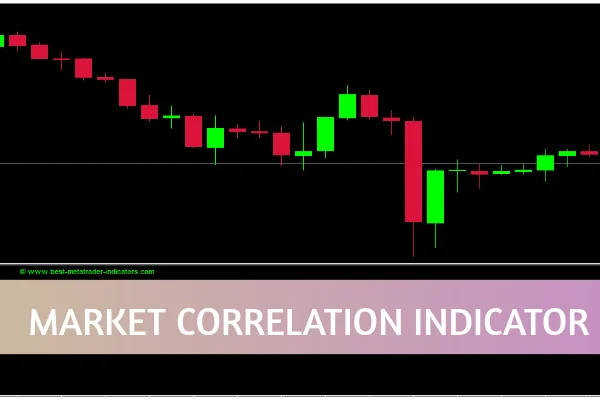
The Market Correlation Indicator for MT4 is a powerful forex analysis tool that displays the real-time correlation between different currency pairs. By plotting correlation values, it allows traders to determine whether two pairs are moving in the same or opposite directions. Understanding these relationships helps traders make more informed decisions, anticipate price behavior, and manage risk effectively.
In simple terms, correlation shows how closely the movement of one currency pair mirrors another. For example, EUR/USD and GBP/USD often have a positive correlation, meaning they move in the same direction most of the time. Conversely, EUR/USD and USD/JPY might show a negative correlation, moving in opposite directions.
The Market Correlation Indicator for MT4 measures the strength of correlation on a scale from +1 to -1:
+1 indicates a perfect positive correlation — both pairs move together.
-1 indicates a perfect negative correlation — pairs move in opposite directions.
0 means no correlation at all.
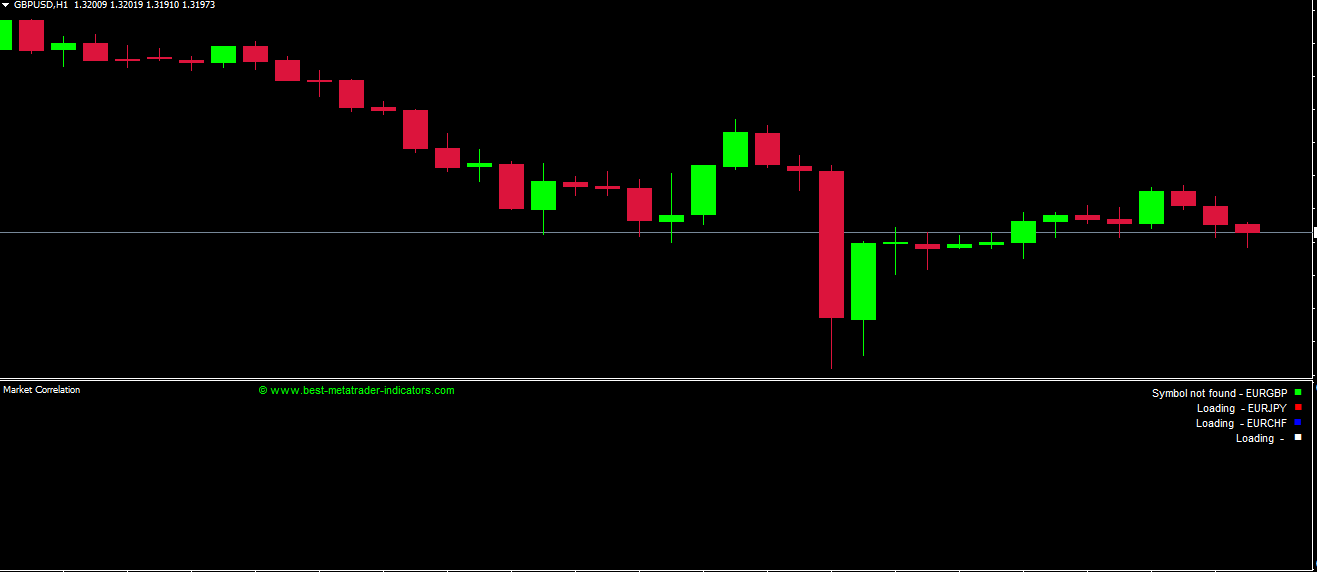
In the indicator window, you’ll see three color-coded lines:
Green Line: Represents EURGBP
Red Line: Represents EURJPY
Blue Line: Represents EURCHF
By analyzing these lines, traders can visualize how each currency pair interacts over time. When the lines move closely together above or below the zero line, it signals a strong positive correlation. If they diverge on opposite sides, it shows a strong negative correlation.
Market correlation analysis is crucial for understanding market dynamics and preventing overexposure. If a trader opens multiple positions in highly correlated pairs, they might unknowingly double their risk. Similarly, knowing negatively correlated pairs helps traders hedge positions strategically.
Benefits of using the Market Correlation Indicator for MT4:
Helps identify trading opportunities using correlated assets.
Assists in avoiding duplicate trades on similar pairs.
Improves portfolio diversification and risk management.
Works seamlessly across all time frames for short and long-term traders.
To use the indicator effectively:
Attach it to your MT4 chart.
Select the desired currency pairs to compare.
Observe the correlation values in real-time on the sub-window.
If correlation values remain close to +1, it indicates both pairs are moving in the same direction. Conversely, values near -1 suggest opposite movements. The indicator doesn’t provide direct buy or sell signals, but it’s an excellent confirmation tool when used alongside other indicators such as RSI, MACD, or Moving Averages.
For best results, analyze correlation across multiple timeframes — for instance, check correlations on both the H1 and D1 charts to confirm broader market trends.
Suppose the EURJPY and EURGBP lines are both above the zero line and close together. This means both pairs are moving in the same direction, and you can monitor them to confirm overall euro strength. Conversely, if EURCHF is below zero while the others are above, it suggests a divergence worth investigating further.
In summary, the Market Correlation Indicator for MT4 is an essential analytical tool for forex traders aiming to understand the relationships between different currency pairs. It enhances decision-making, reduces redundant trades, and supports smarter portfolio management.
Visit IndicatorForest.com to download the Market Correlation Indicator for MT4 and explore more powerful forex tools to improve your trading performance.
Published:
Oct 30, 2025 04:04 AM
Category: