The Market Trend Scanner Indicator is a powerful and user-friendly tool designed for traders who rely on multi-timeframe analysis. By visually displaying trend directions across several timeframes, it helps simplify complex market data and reveals the most promising trading opportunities. Whether you’re a scalper, day trader, or swing trader, this indicator provides precise insights that enhance decision-making and trading accuracy.
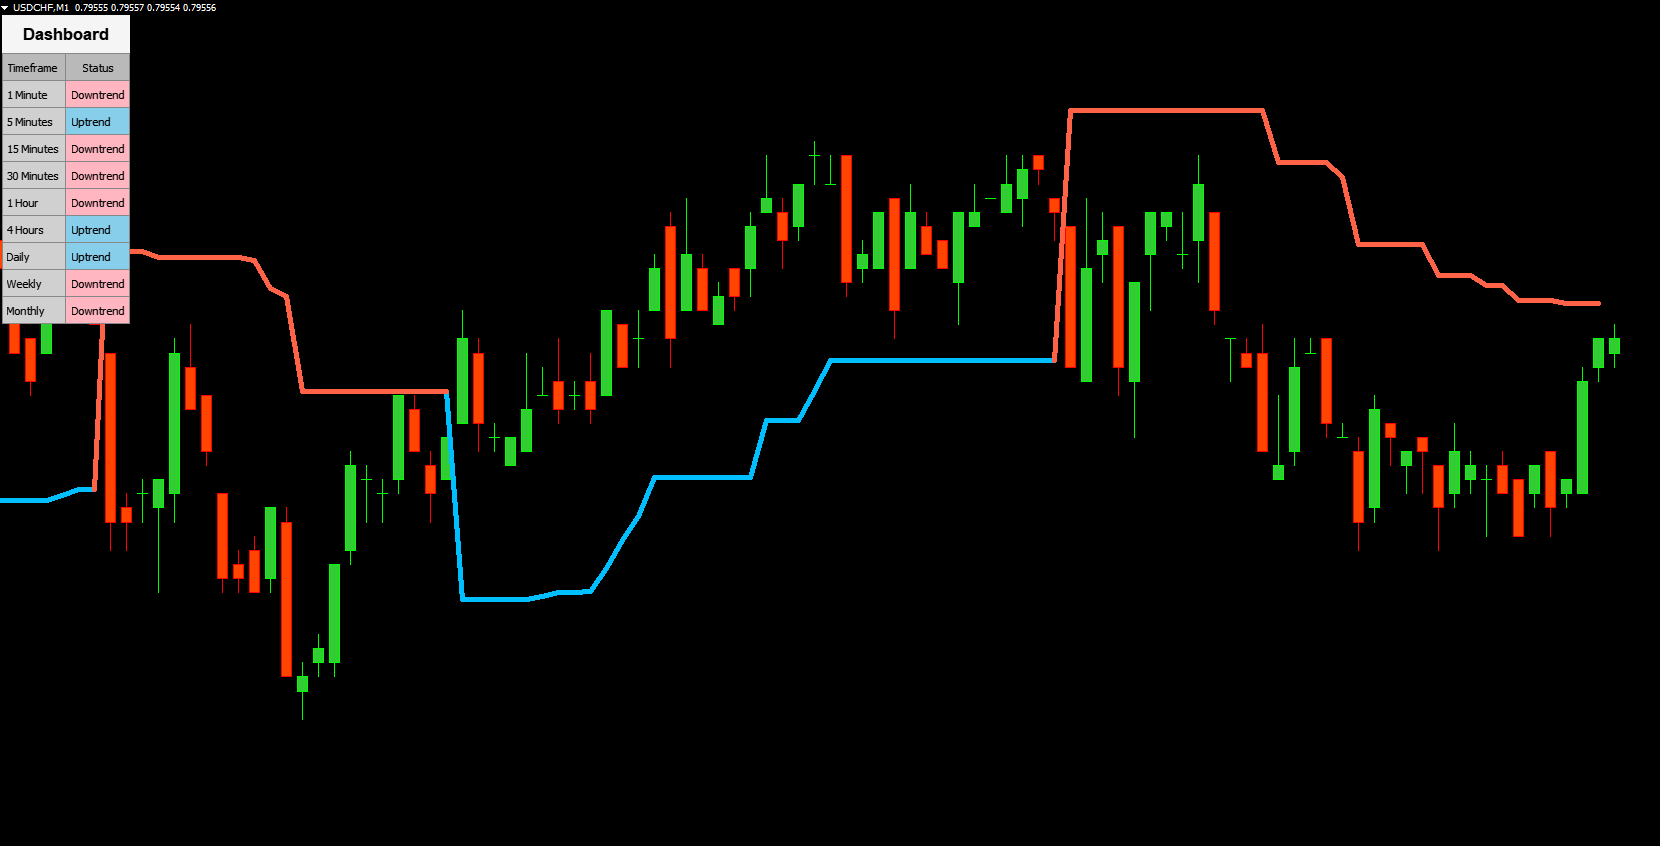
The Market Trend Scanner Indicator analyzes price movements across different timeframes and presents them in an easy-to-read dashboard. Instead of switching between multiple charts, traders can instantly see which way the market is moving.
Uptrend → Displayed in blue
Downtrend → Displayed in red
This color-coded interface allows traders to assess market direction at a glance. The indicator works with major trading platforms and supports customizable settings, enabling users to tailor it to their preferred strategies.
Unlike standard indicators that analyze one timeframe at a time, the Market Trend Scanner Indicator simultaneously examines several — from 1-minute to daily charts. This comprehensive approach reveals trend alignment and momentum consistency across timeframes, key factors in identifying strong trading signals.
For example, when the 1-hour, 4-hour, and daily charts all show a bullish trend, it often indicates robust upward momentum, signaling a potential buy opportunity. Conversely, if the lower timeframes diverge from the higher ones, traders might anticipate a market reversal or correction.
The Market Trend Scanner delivers clear, color-coded trading signals that guide you in real time. Blue signals represent bullish trends, while red ones mark bearish momentum. Traders can easily interpret these signals to confirm trade entries or exits.
Divergences between timeframes can act as early warnings for potential reversals. For instance, if short-term charts indicate strength while the daily chart weakens, the scanner helps you prepare for changing market dynamics. This gives you an edge in adjusting positions before larger market shifts occur.
The Market Trend Scanner Indicator stands out for its simplicity, accuracy, and adaptability. It eliminates guesswork by providing objective, visually clear information.
Key benefits include:
✅ Comprehensive multi-timeframe overview
✅ Intuitive visual dashboard for quick analysis
✅ Early detection of market reversals
✅ Customizable settings for any trading strategy
✅ Compatible with most popular trading platforms
Whether you trade forex, indices, commodities, or cryptocurrencies, the indicator adapts seamlessly to your preferred market.
Install and configure the indicator on your trading platform.
Select preferred timeframes based on your strategy (e.g., M15, H1, H4, D1).
Observe color patterns across timeframes — aligned blue or red signals indicate trend strength.
Combine with your strategy — use the scanner’s insights to validate entries, exits, and stop-loss placements.
Using the Market Trend Scanner alongside tools like support and resistance levels or momentum indicators can significantly improve the accuracy of your trades.
The Market Trend Scanner Indicator is an indispensable asset for traders looking to simplify their analysis while maintaining precision. Its multi-timeframe scanning, visual clarity, and customizable interface make it suitable for both beginners and advanced traders.
By delivering clear insights and actionable signals, the indicator empowers users to make confident trading decisions.
👉 Take your trading to the next level — download the Market Trend Scanner today at IndicatorForest.com and experience a smarter way to analyze market trends.
Published:
Oct 24, 2025 15:40 PM
Category: