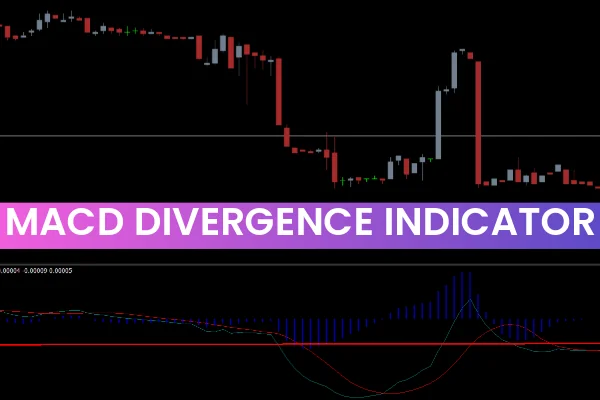
The MACD Divergence Indicator MT4 is one of the most effective tools for identifying early trend reversals and Trend Continuation setups in forex trading. Divergence occurs when price action and an oscillator move in opposite directions. This dissimilar movement often acts as a powerful signal that the market is preparing for a shift. Among all oscillators, the MACD is widely considered the best for spotting divergence because of its ability to combine trend momentum and direction in one window.
The MACD Divergence Indicator for MT4 simplifies this entire process by automatically detecting both regular and hidden divergence, helping traders catch high-probability entries with reduced risk.
The Foundation of the MACD Divergence Indicator
The indicator includes several components that work together to give an accurate picture of market strength:
MACD Volume Histogram – Shows momentum direction and strength
12 EMA & 25 EMA – Identify trend reversals
Automatic Divergence Detection – Spots regular and hidden divergence patterns instantly
The histogram highlights momentum changes, while the EMAs reveal crossovers that confirm buying or selling opportunities. For advanced traders, this combination becomes a powerful toolkit to catch early reversals or stay aligned with the trend.
The indicator scans the chart and marks divergence setups that many traders miss when analyzing manually.
How to Spot Divergence Using the MACD Divergence Indicator
Divergence is categorized into regular and hidden divergence. Each type provides a different message about the market.
Regular Divergence (Trend Reversal Signals)
Regular divergence helps traders catch market turning points.
Bullish Regular Divergence
MACD makes higher lows
Price makes lower lows
Signals uptrend reversal → buy
Bearish Regular Divergence
MACD makes lower highs
Price makes higher highs
Signals downtrend reversal → sell
Hidden Divergence (Trend Continuation Signals)
Hidden divergence supports entering trades in the direction of the existing trend.
Bullish Hidden Divergence
MACD makes lower lows
Price makes higher lows
Signals bullish trend continuation → buy
Bearish Hidden Divergence
MACD makes higher highs
Price makes lower highs
Signals bearish trend continuation → sell
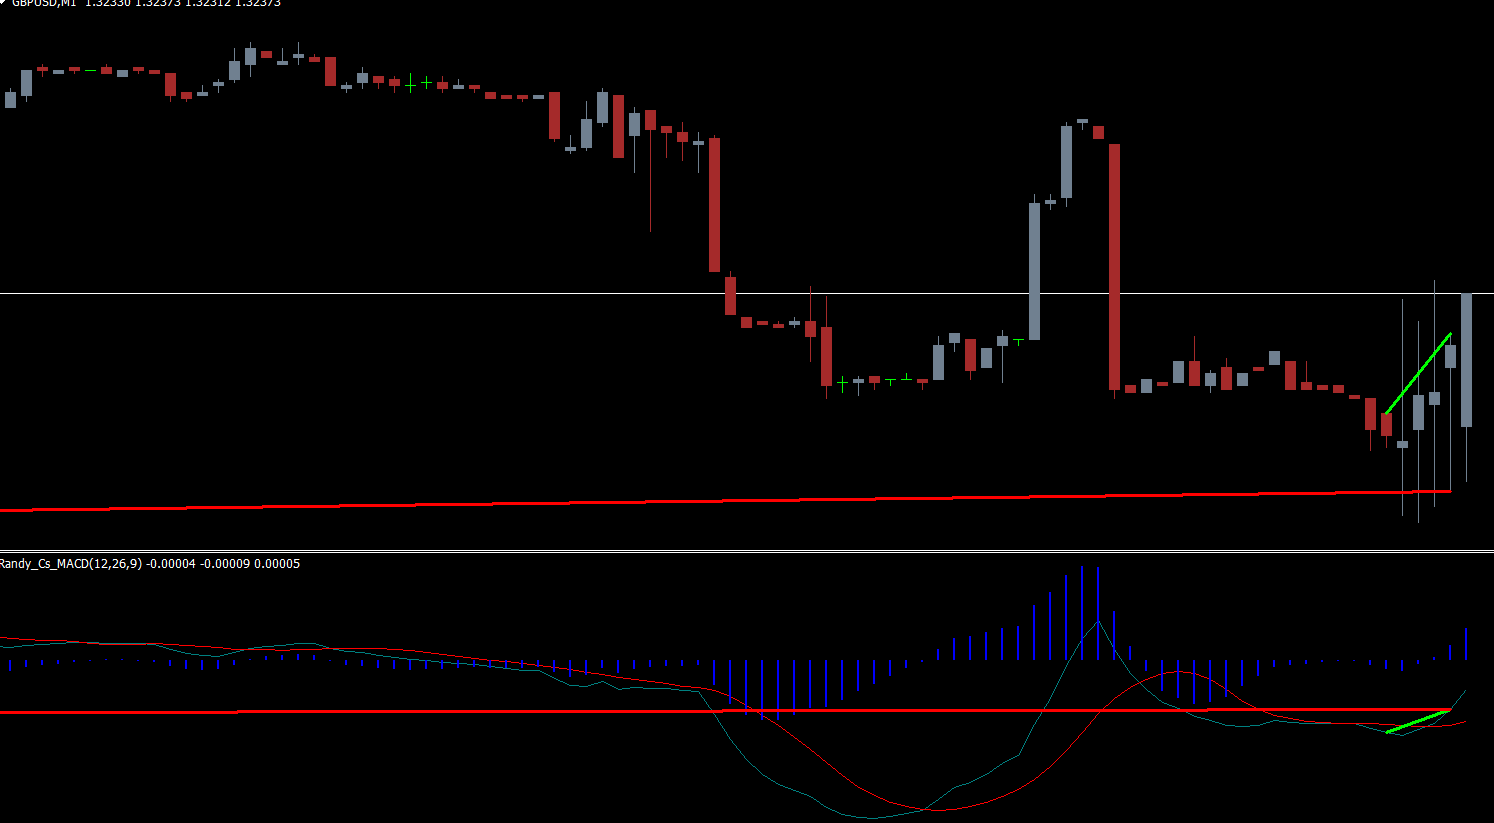
Using the MACD Divergence Indicator, these setups appear automatically on your MT4 chart with trendlines drawn between MACD and price—making analysis clear and easy.
How to Use the MACD Divergence Indicator for Trading
The indicator combines divergence with EMA crossovers for precise trade entries.
Bullish Regular Divergence – Buy Setup
A bullish regular divergence signals that a downtrend is ending.
Identify a MACD higher low while price creates a lower low.
Look for bullish confirmation such as an engulfing candle.
Enter a buy position when the 12 EMA crosses above the 25 EMA.
Place stop-loss below recent swing low.
Exit when the 12 EMA crosses below the 25 EMA.
This method catches early trend reversals with strong momentum.
Bearish Regular Divergence – Sell Setup
A bearish regular divergence signals that an uptrend is weakening.
MACD forms a lower high while price forms a higher high.
Look for reversal candlestick patterns such as a Doji.
Sell when the 12 EMA crosses below the 25 EMA.
Place stop-loss above recent swing high.
Exit when the EMAs cross upward or structure breaks.
Hidden Divergence – Continuation Trades
Hidden divergence is ideal for traders who like trend-following strategies.
Example (EUR/USD H4 chart):
A bullish hidden divergence formed, signaling continuation of the uptrend.
Entry confirmed when the 12 EMA crossed above the 25 EMA.
Stop-loss under the swing low (1.1823).
Partial profits taken around previous support at 1.1823.
Final exit when EMAs crossed down.
This setup allows traders to follow the institutional order flow without guessing tops and bottoms.
Best Timeframes for the MACD Divergence Indicator
For accurate results, use the indicator on:
H1 (1 Hour)
H4 (4 Hour)
Daily timeframe
These higher timeframes filter noise and provide more reliable divergence signals.
Conclusion
The MACD Divergence Indicator MT4 is an essential tool for traders who rely on early trend detection. It identifies both regular and hidden divergence automatically, highlights momentum shifts, and confirms trades using EMA crossovers. Whether you're a trend follower or reversal trader, this indicator offers clarity, precision, and confidence in your analysis.
For more free MT4 indicators, trading tools, and strategies, visit IndicatorForest.com.
FAQ
4 Downloads
Published:
Nov 29, 2025 00:56 AM
Category: