The RSI Heatmap MT5 Indicator is a powerful tool that helps forex traders determine the strength of currencies using the Relative Strength Index (RSI). By analyzing the momentum of individual currencies, this indicator provides a clear visual representation of strength, allowing traders to identify strong and weak currencies across multiple timeframes simultaneously.
The heatmap is especially useful for multi-currency analysis, as it consolidates data for multiple currency pairs in a single view. Traders no longer need to manually calculate RSI values for every pair, saving both time and effort.
How the RSI Heatmap MT5 Indicator Works
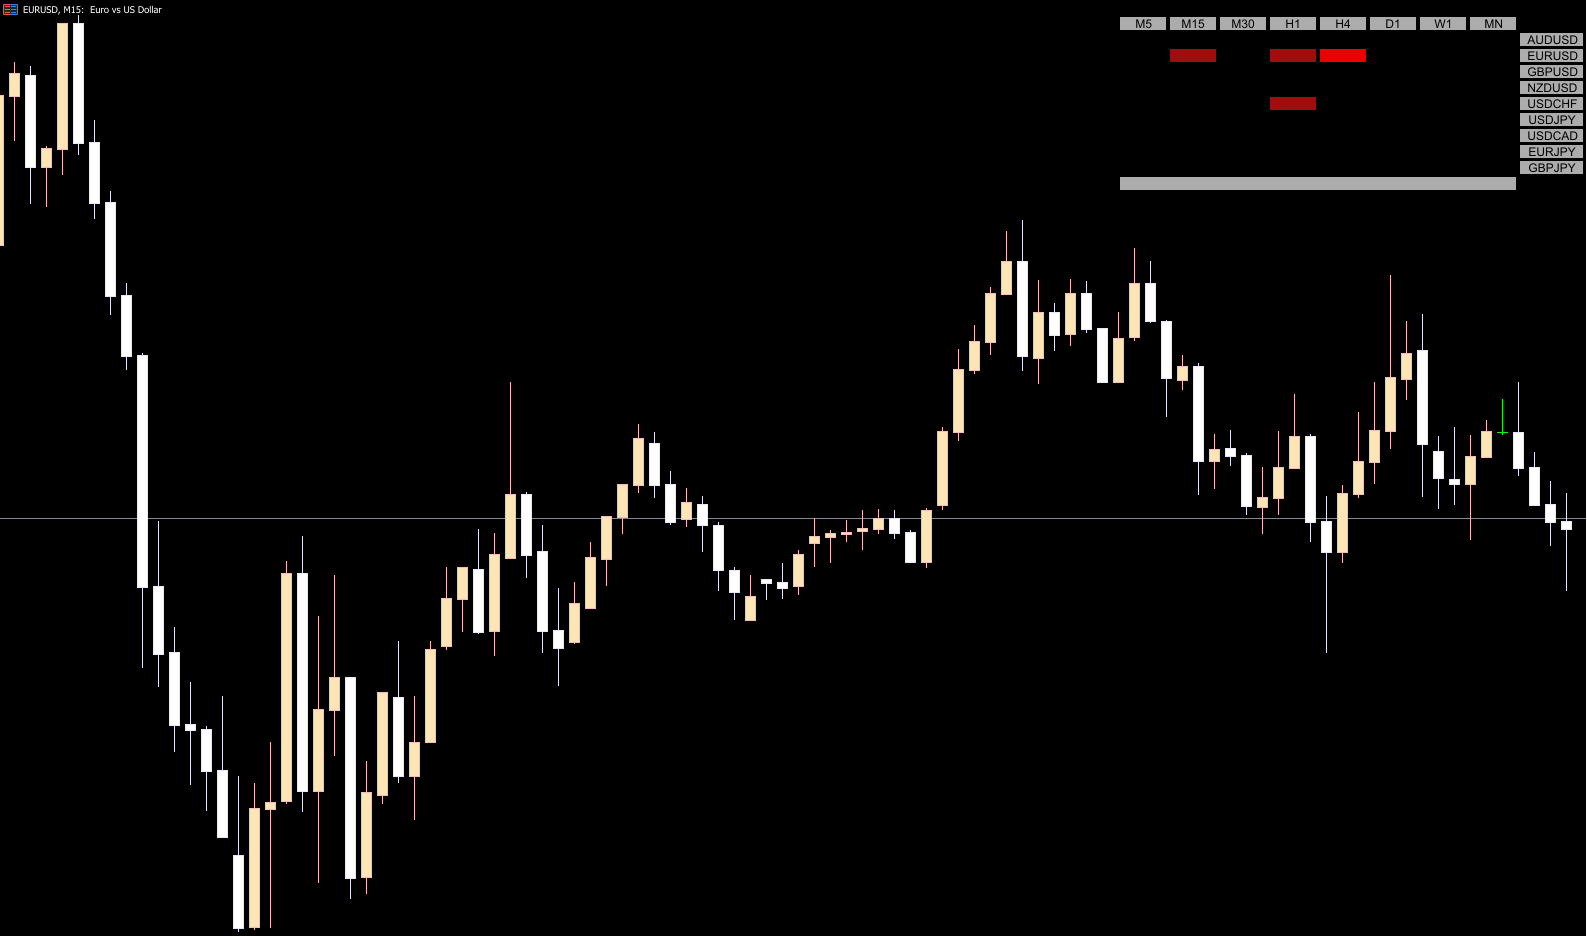
The RSI Heatmap uses RSI values and price direction to calculate currency strength. It presents this information using a color-coded heatmap, where each color corresponds to a level of currency strength:
Green / Light Green: Weak to strong bullish momentum
Red / Firebrick: Strong to weak bearish momentum
These color transitions provide immediate visual cues to traders about the relative strength of a currency.
The indicator also allows users to monitor multiple currencies and timeframes at once. This gives traders a more comprehensive view of the forex market and helps identify the strongest trends efficiently.
Trading Strategy Using the RSI Heatmap
BUY Signals
Identify a currency that is strengthening across multiple pairs.
Observe the heatmap color transition from green to light green.
Confirm with trend analysis or Price Action.
Place a buy order for pairs where the base currency is gaining strength.
SELL Signals
Identify a currency that is weakening across multiple pairs.
Observe the heatmap color transition from firebrick to red.
Confirm with trend analysis or price action.
Place a sell order for pairs where the base currency is losing strength.
Multi-Timeframe Confirmation
A strong signal occurs when the heatmap shows a consistent color change across several timeframes. For example, if the heatmap shows a green-to-light-green transition on M15, H1, and H4, it indicates a robust bullish momentum for that currency.
Advantages of the RSI Heatmap MT5 Indicator
Quick visual insights: Easily see the strongest and weakest currencies at a glance.
Multi-timeframe analysis: Monitors multiple timeframes without switching charts.
Color-coded strength: Instantly identifies bullish and bearish momentum.
Easy to use: Intuitive layout for beginner and advanced traders alike.
Supports strategic trading: Works well for currency strength strategies and RSI-based setups.
The indicator can also be used to track individual currencies. For example, listing all pairs with GBP allows traders to analyze the overall strength or weakness of the pound sterling and make more informed trades.
Conclusion
The RSI Heatmap MT5 Indicator is a must-have tool for forex traders who rely on currency strength analysis. By leveraging RSI data and color-coded heatmaps, traders can easily identify trends, strength shifts, and potential entry or exit points. Its ability to monitor multiple currencies and timeframes simultaneously makes it a highly efficient tool for both short-term and long-term trading strategies.
Download the RSI Heatmap MT5 Indicator from IndicatorForest.com today and enhance your currency strength analysis.
FAQ
Published:
Nov 28, 2025 11:27 AM
Category: