Master Currency Interdependence with the Historical Correlation Indicator for MT4
In the complex ecosystem of the foreign exchange market, no currency pair exists in a vacuum. Every movement in the EUR/USD can ripple through the GBP/USD or the USD/CHF. Understanding these relationships is not just a luxury—it is a necessity for professional risk management. The Historical Correlation Indicator for MT4 is a powerful analytical tool that quantifies the relationship between multiple assets, giving traders a mathematical edge in a volatile market.
What is Currency Correlation?
Currency correlation measures the degree to which two currency pairs move in relation to each other. This is expressed as a coefficient between -1.0 and +1.0:
- Positive Correlation (+1.0): The pairs move in the same direction.
- Negative Correlation (-1.0): The pairs move in opposite directions.
- Zero Correlation (0): The movements are completely random and unrelated.
Why Every MT4 Trader Needs This Tool
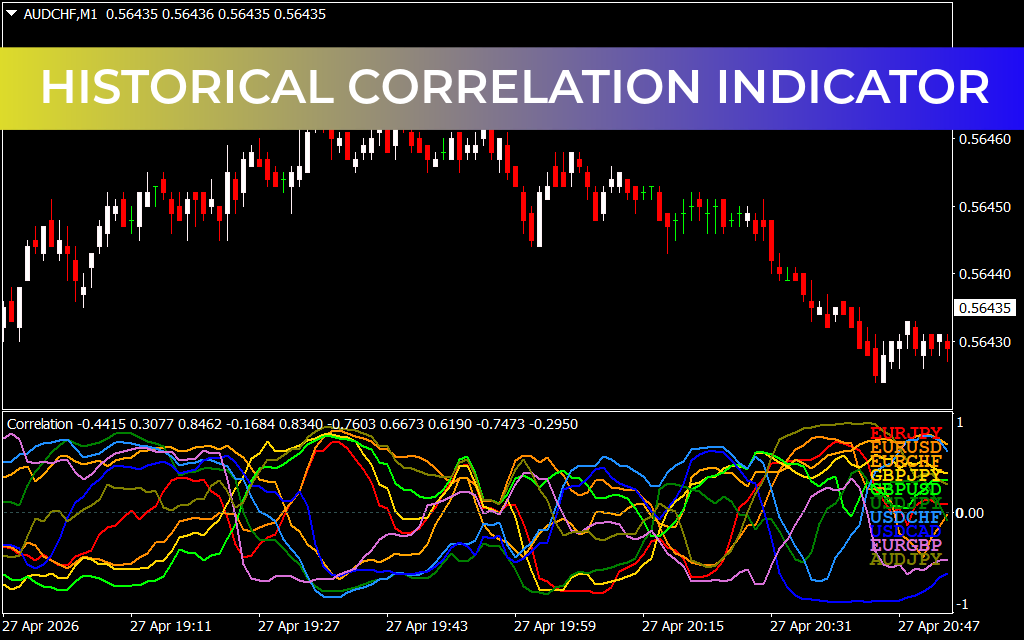
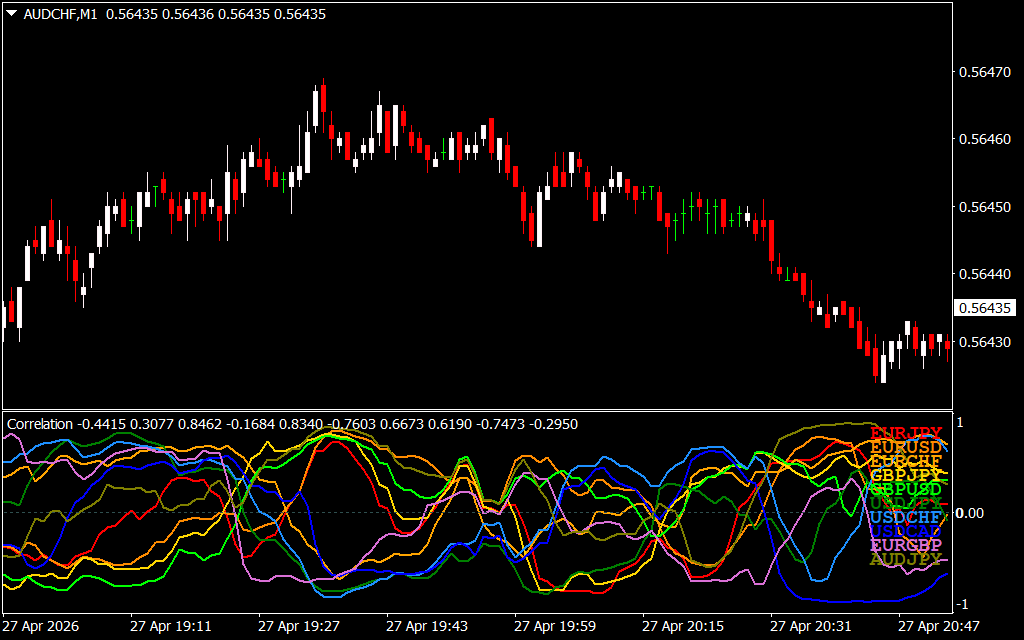
The Historical Correlation Indicator provides a visual, multi-line representation of these relationships in real-time. By monitoring the "sub-window" lines, traders can avoid common pitfalls that ruin beginner accounts.
1. Avoid Over-Exposure Many traders unknowingly double their risk by opening "Buy" positions on two highly correlated pairs, such as EUR/USD and GBP/USD. If the US Dollar strengthens, both trades will likely hit their stop losses simultaneously. The Correlation Indicator alerts you when your portfolio is too heavily weighted in one direction.
2. Spotting Divergence and Reversals When two historically correlated pairs suddenly begin to diverge, it often signals a looming market shift. For example, if the AUD/JPY and the S&P 500—which usually move together—start moving in opposite directions, it may indicate a "hidden" change in global risk sentiment before it becomes obvious on the price chart.
3. Hedging Strategies Professional traders use negative correlation to hedge their positions. By opening a position in a negatively correlated pair, you can offset potential losses during periods of high volatility, protecting your equity without closing your primary trade.
Visualizing Complex Data
As seen in the "Double Dragon" style correlation maps, this indicator tracks a basket of currencies (EUR, GBP, AUD, JPY, etc.) against a base asset. The resulting multi-colored histogram or line chart allows you to identify which currencies are currently the strongest and weakest relative to the entire market. This "Strength vs. Weakness" analysis is the foundation of high-probability trend trading.
Whether you are a scalper looking for quick momentum or a swing trader managing a multi-pair portfolio, the Historical Correlation Indicator transforms raw price data into a clear map of market interconnectedness.
3 Downloads
Last Update:
Apr 28, 2026 01:38 AM
Published:
Jan 31, 2026 20:24 PM
Category: