Master Price Action with the Fractals Adjustable Period SR Indicator
In the world of technical analysis, few concepts are as foundational as Support And Resistance (SR). Identifying where price is likely to stall or reverse is the cornerstone of any successful trading strategy. However, the biggest challenge for many traders is distinguishing minor price fluctuations from significant structural turning points. The Fractals Adjustable Period SR Indicator is a premier technical tool designed to automate this process, providing a clean, objective, and mathematical approach to mapping Market Structure on any timeframe.
The Power of Dynamic Fractals
The indicator is based on Bill Williams' classic fractal theory but adds a critical layer of professional customization: an adjustable period. While standard fractals are fixed to a 5-bar formation, this indicator allows you to define the "strength" of the turning point. By increasing the period, you filter out market noise and focus solely on major institutional pivot points. Conversely, a lower period allows scalpers to identify intraday micro-levels with high precision.
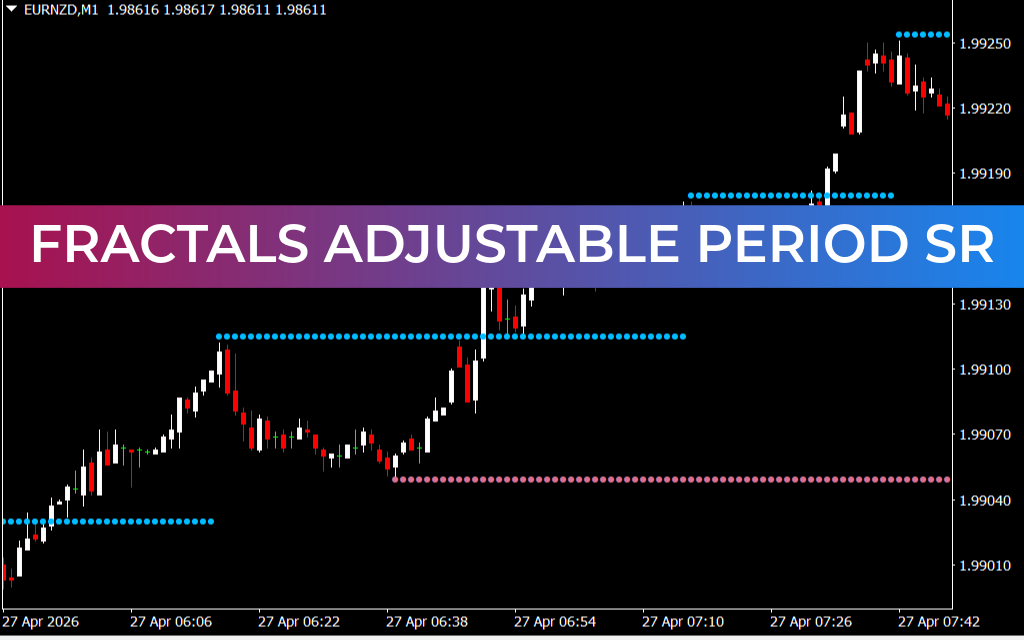
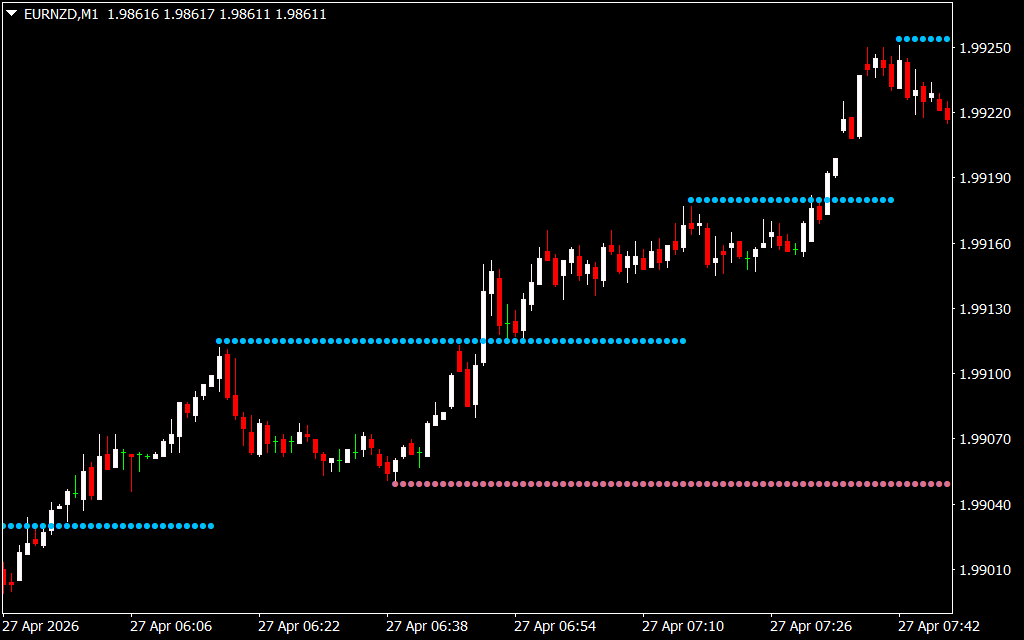
As seen in the EURNZD M1 chart, the indicator visualizes these structural levels as distinct horizontal dotted lines:
- Blue Dotted Lines: Represent resistance levels derived from fractal peaks. When price approaches these zones, it indicates a high probability of selling pressure or a potential breakout opportunity.
- Red Dotted Lines: Represent support levels derived from fractal troughs. These zones highlight where buyers have historically stepped in, providing low-risk entry points for long positions.
Strategic Execution: From Scalping to Swing Trading
The Fractals Adjustable Period SR Indicator is a versatile powerhouse that fits into any trading style. Because it identifies levels based on actual Price Action rather than lagging mathematical averages, it is highly reactive to current market conditions.
- Level Breakouts: Traders can use the blue and red lines as definitive breakout triggers. A candle closing above a blue fractal line often signals the start of a fresh bullish expansion, as seen in the EURNZD example where price broke a previous high and accelerated.
- Stop-Loss Placement: One of the most effective uses for this indicator is objective risk management. By placing your stop-loss just beyond the most recent red (support) or blue (resistance) line, you ensure your trade is protected by a proven structural level.
- Trend Confirmation: When the indicator creates a "ladder" of higher blue lines and higher red lines, it confirms a healthy uptrend. If the ladder breaks, it provides an early warning of a potential Trend Reversal.
A Clean Chart for Clear Decisions
Trading is often about psychological clarity. The Fractals Adjustable Period SR Indicator cleans up your charts by removing the need for manual trendline drawing. It provides a consistent, rule-based framework that looks exactly the same every time you open a chart, reducing the cognitive load on the trader.
Whether you are navigating the volatile M1 Scalping environment or looking for major swing levels on the H4 timeframe, this indicator provides the structural backbone you need. By focusing on the levels that truly matter, you align your strategy with the natural flow of the market, allowing you to trade with professional-grade confidence and surgical precision.
33 Downloads
Last Update:
Apr 27, 2026 15:31 PM
Published:
Feb 01, 2026 19:35 PM
Category: