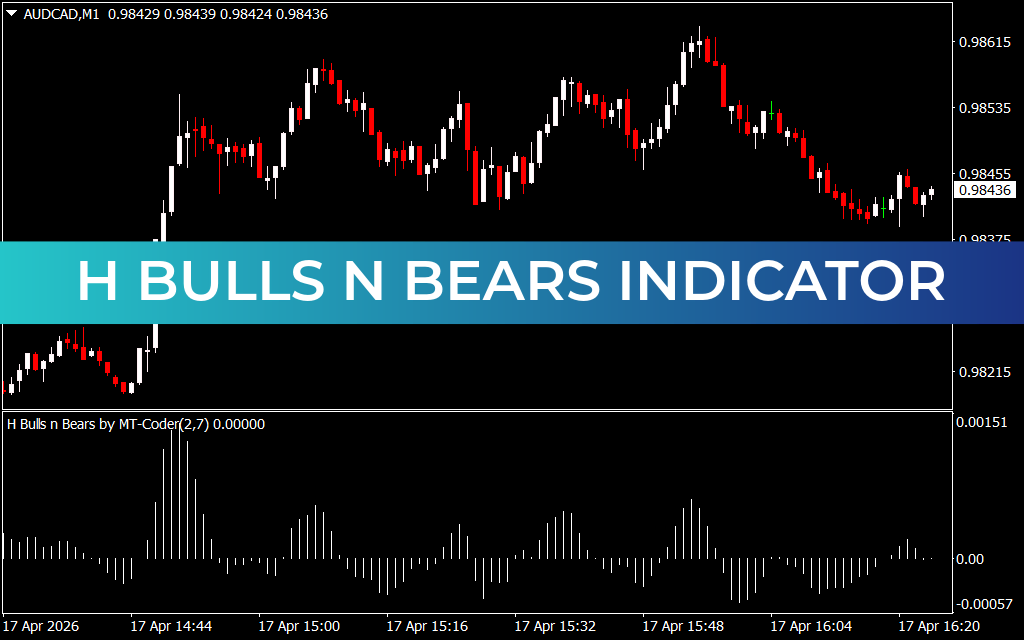
Master Market Sentiment with the H Bulls n Bears Indicator for MT4
In the fast-paced world of Forex trading, the ability to quickly distinguish between bullish accumulation and bearish distribution is the hallmark of a successful professional. While Price Action tells you where the market is going, sentiment indicators tell you the conviction behind the move. The H Bulls n Bears Indicator for MetaTrader 4 (MT4) is a sophisticated momentum oscillator designed to provide a crystal-clear visual representation of market power, allowing traders to align themselves with the dominant force in real-time.
The Science of Sentiment and Power
The H Bulls n Bears Indicator functions by measuring the relative strength of buyers (Bulls) against sellers (Bears) over a specific look-back period. Unlike standard oscillators that can become "pinned" at extreme levels during strong trends, this indicator utilizes a histogram-based approach to show the ebb and flow of market pressure.
As demonstrated in technical analysis on high-frequency charts like the AUD/CAD M1, the H Bulls n Bears system provides a definitive structural edge:
- Binary Histogram Logic: The indicator operates in a dedicated sub-window below the main price chart. Vertical bars rising above the zero line represent bullish dominance, while bars falling below the zero line signify bearish control. This immediate visual feedback eliminates the "analysis paralysis" common with complex technical overlays.
- Volume-Weighted Momentum: The "H" in the indicator's name refers to its smoothed algorithmic approach. It filters out minor market noise and "whipsaws," ensuring that the histogram only shifts significantly when there is a genuine change in directional conviction.
- Divergence Detection: One of the most powerful uses of the H Bulls n Bears Indicator is identifying price-momentum divergence. If price makes a new high but the bullish histogram bars are shorter than the previous peak, it signals an exhausted trend and a high-probability reversal opportunity.
- Zero-Line Cross Signals: The moment the histogram crosses from negative to positive (or vice versa) serves as a high-conviction entry trigger. As seen in the AUD/CAD M1 analysis, these crosses often precede explosive momentum moves.
Strategic Advantages for Professional Execution
The H Bulls n Bears Indicator is an essential asset for traders who prioritize systematic, data-driven execution.
- Identify High-Probability Reversals: By monitoring the height of the histogram bars, traders can see when a trend is accelerating or decelerating before price action fully reflects the change.
- Universal Asset Compatibility: Whether you are trading major Forex pairs, volatile Indices, or Commodities, the indicator’s mathematical foundation remains robust across all asset classes.
- Perfect for Confluence Trading: This tool acts as an excellent secondary filter for any strategy. For example, a breakout trader might only enter a "Long" position if the H Bulls n Bears histogram is also showing strong green (bullish) conviction.
- Optimized for Scalping and Day Trading: On lower timeframes like M1 or M5, the indicator reacts with the precision necessary to capture quick intra-day momentum shifts while maintaining a smooth, readable output.
Conclusion
The H Bulls n Bears Indicator for MT4 is a definitive solution for traders seeking to master market sentiment. By bridging the gap between raw price action and smoothed momentum analysis, it empowers you to navigate the financial markets with professional-grade clarity and confidence. Elevate your MT4 terminal today and start trading with the power of the H Bulls n Bears system.
1 Download
Last Update:
Apr 17, 2026 19:25 PM
Published:
Feb 09, 2026 12:33 PM
Category: