The GG TrendBar Indicator for MT4 is a powerful forex tool designed to display trend strength across multiple timeframes directly on one chart. It combines the Average Directional Index (ADX) and Parabolic Stop and Reverse (PSAR) indicators to deliver a clear visual representation of whether the market is bullish, bearish, or neutral.
By presenting this data in an easy-to-interpret format, the indicator helps traders at all experience levels make better decisions. Whether you’re a day trader analyzing short-term charts or a swing trader looking for long-term confirmation, the GG TrendBar Indicator for MT4 provides reliable trend insights that can improve your trading accuracy.
How the GG TrendBar Indicator Works
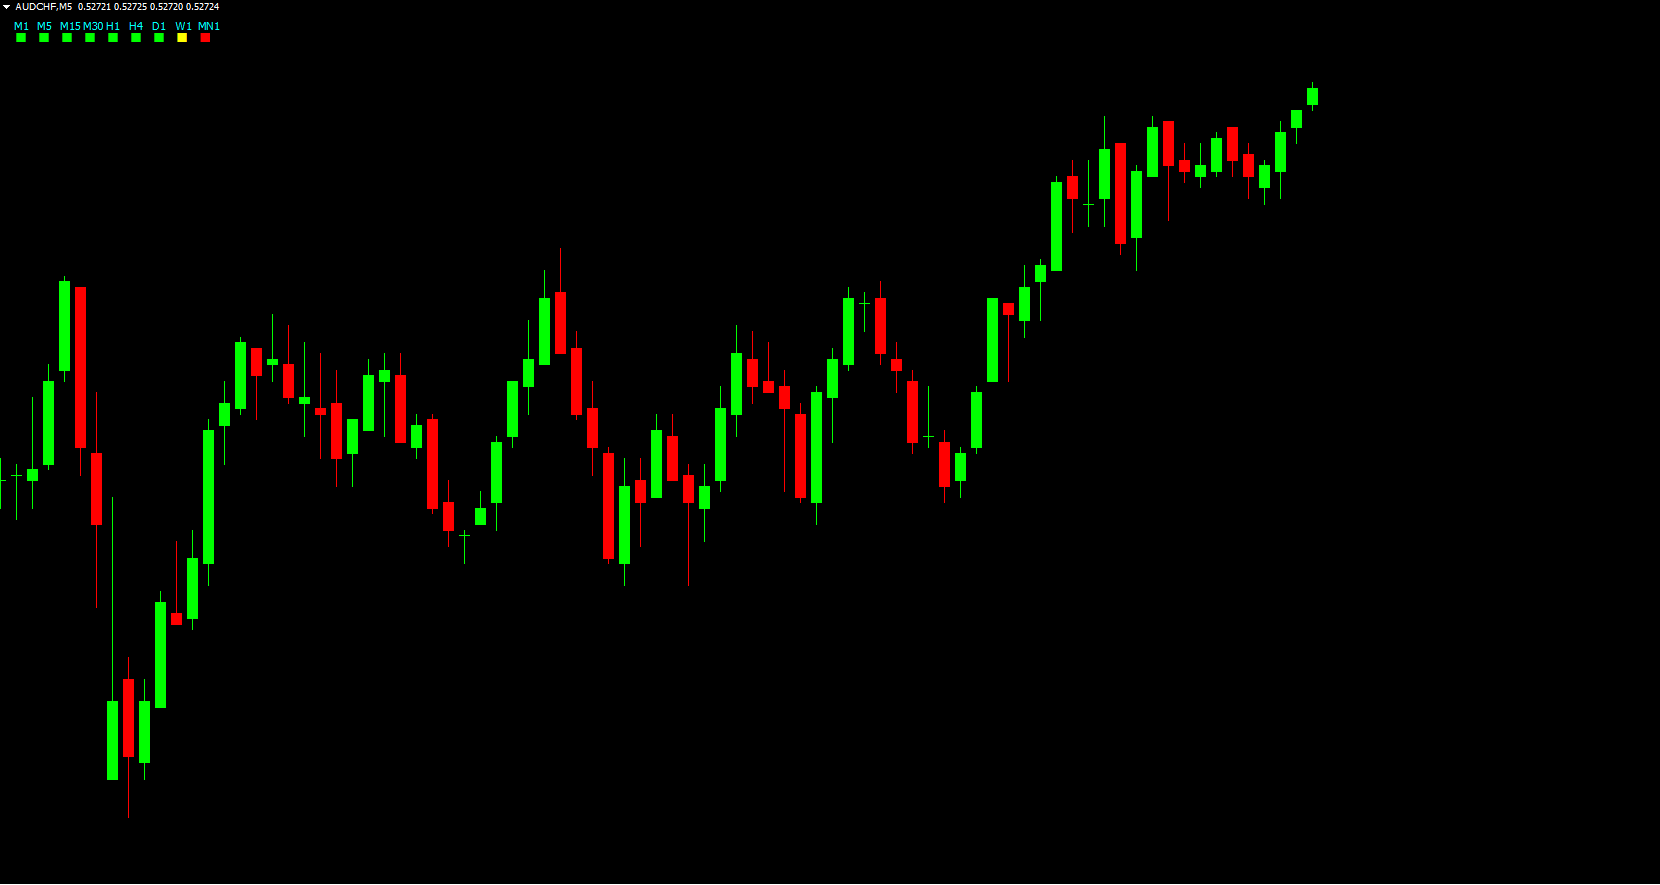
The indicator displays colored boxes representing different timeframes — from M1 to D1 or even weekly.
Each box reflects the dominant trend direction for that specific timeframe:
Lime Green: Bullish trend
Red: Bearish trend
Yellow: Neutral trend
Behind the scenes, the ADX measures Trend Strength, while PSAR identifies directional movement. The combination ensures that traders can quickly recognize the overall market condition and decide whether to enter, hold, or exit a trade.
GG TrendBar Indicator Setup and Interpretation
Installing and using the GG TrendBar Indicator for MT4 is straightforward. After attaching it to your chart, the indicator plots color-coded squares—usually in the upper-left corner—showing the trend status for multiple timeframes.
This simple yet effective design makes it ideal for both beginners and advanced forex traders.
Buy Trade Setup
If the current chart timeframe and the next two higher timeframes all display green (bullish) boxes, it signals a potential buy opportunity. This setup suggests strong upward momentum across timeframes, which can increase the probability of a profitable trade.
Sell Trade Setup
Conversely, when the current timeframe and the next two higher ones turn red (bearish), it may indicate a favorable condition for short selling. The consistency of bearish signals across timeframes adds confidence to the trade direction.
Exit Strategy
Traders should consider closing their positions if the boxes turn yellow (neutral) or switch to the opposite color, signaling a possible shift in trend direction.
This visual approach simplifies decision-making and helps manage risk effectively.
Advantages of the GG TrendBar Indicator for MT4
Multi-Timeframe Analysis:
Instantly view trend strength from multiple chart periods in one glance.
Combines Proven Indicators:
Integrates ADX and PSAR for accurate and consistent trend readings.
Clear Visual Cues:
Color-coded boxes make interpretation effortless for new traders.
Applicable to All Pairs and Timeframes:
Works effectively for any forex pair and across all trading styles.
Enhances Technical Analysis:
Acts as a confirmation tool when used with other strategies or indicators.
Tips for Using GG TrendBar Effectively
To maximize results with the GG TrendBar Indicator for MT4, consider these tips:
Combine it with Price Action or support/resistance analysis for confirmation.
Avoid trading when most boxes show yellow, as it indicates uncertainty.
Use appropriate stop loss and take profit targets based on trend strength.
Apply it on higher timeframes (H1 and above) for more reliable trend direction.
For detailed setup instructions and other professional indicators, visit IndicatorForest.com and explore our growing collection of MT4 tools.
Conclusion
In summary, the GG TrendBar Indicator for MT4 is an essential addition to any trader’s toolkit. By combining ADX and PSAR, it delivers accurate multi-timeframe trend visualization — enabling traders to recognize bullish, bearish, or neutral market conditions at a glance.
Whether you’re a new or experienced trader, this indicator can enhance your market analysis and improve trading decisions.
👉 Start optimizing your forex trades today — download and explore more indicators at IndicatorForest.com.
Published:
Nov 03, 2025 00:23 AM
Category: