Precision Cycles: Mastering the FTLM STLM Indicator for MT4
In the modern trading landscape, static indicators often struggle to keep pace with the dynamic shifts of global markets. To gain a competitive edge, professional traders turn to digital signal processing (DSP) to identify underlying market cycles. The FTLM STLM Indicator is a sophisticated technical suite for MetaTrader 4 that utilizes high-frequency and low-frequency digital filters to provide a high-definition view of trend direction and momentum.
Understanding FTLM and STLM
This indicator suite consists of two primary components that work in tandem to reveal the market’s "inner pulse":
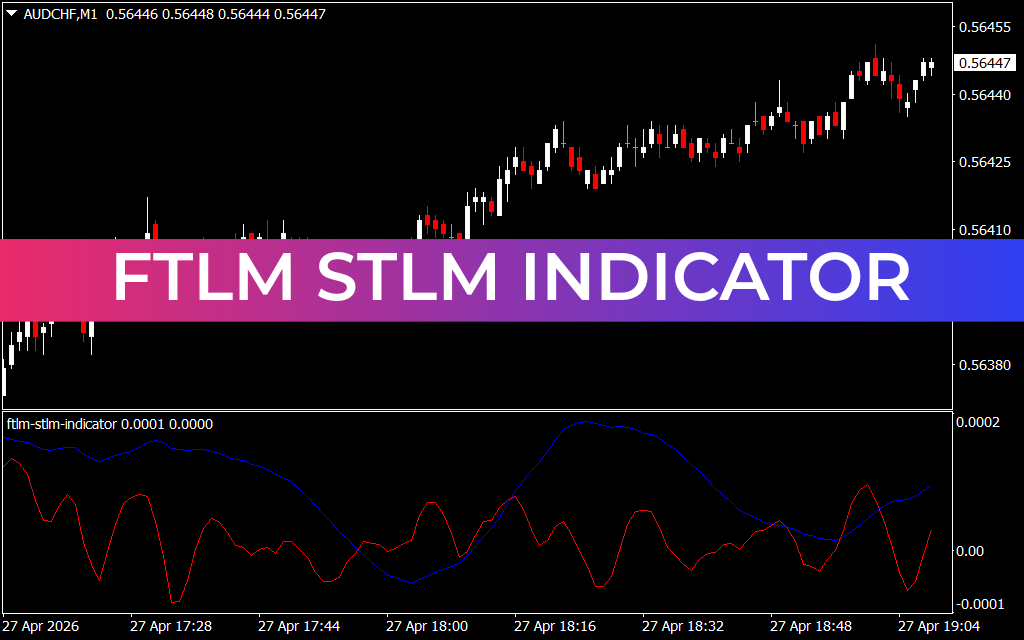
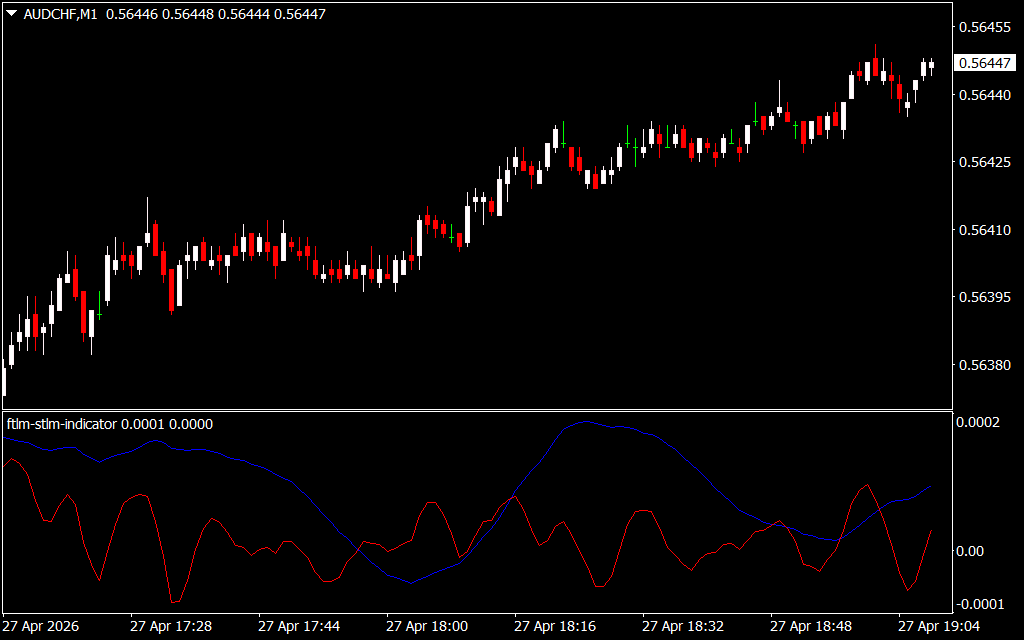
- FTLM (Fast Trend Line Momentum): This represents a "high-pass" digital filter. It is designed to capture short-term momentum and rapid price shifts. On the provided AUD/CHF M1 chart, the FTLM is the faster-oscillating red line. It reacts quickly to price changes, making it an excellent tool for timing precise entries.
- STLM (Slow Trend Line Momentum): This is a "low-pass" digital filter that tracks the broader, more stable trend. Represented by the smoother blue line in the sub-window, the STLM filters out daily noise and focuses on the dominant market direction.
Together, these lines create a powerful picture of market equilibrium and divergence.
The Advantage of Digital Filtering
Most traditional indicators, like the Simple Moving Average (SMA), suffer from significant lag. By the time they signal a trend change, the move is often exhausted. The FTLM STLM Indicator solves this by using advanced mathematical algorithms to calculate the rate of change in price without the traditional delay.
- Trend Confirmation: When both the FTLM (red) and STLM (blue) are moving in the same direction, it confirms a high-conviction trend.
- Early Warning Signals: Because the FTLM is more sensitive, it will often peak and turn before the STLM. This provides an early warning that the current momentum is fading, allowing traders to tighten stop losses or take profits before a major reversal.
- Cyclic Analysis: Markets move in waves. The FTLM STLM indicator helps visualize these waves, identifying overextended conditions when the gap between the two lines becomes excessively wide.
Trading Strategy: The Crossover and Zero-Line Sweep
The most effective way to utilize the FTLM STLM Indicator is by monitoring its relationship with the zero-midline.
- Bullish Scenario: Look for the faster FTLM (red) to cross above the zero line while the STLM (blue) is also in an upward trajectory. This indicates that short-term momentum is aligning with a new long-term trend. As seen in the AUD/CHF chart, a sustained climb in both lines perfectly maps to the strong bullish Price Action.
- Bearish Scenario: A cross of both lines below the zero level indicates that bearish pressure is mounting across multiple time horizons.
Conclusion
The FTLM STLM Indicator is a "must-have" for traders who value mathematical precision over subjective analysis. By separating market noise from meaningful trend cycles, it provides the structural clarity needed to navigate complex volatility. Whether you are scalping on the M1 or swing trading on higher timeframes, this digital filtering tool offers a professional edge in trend forecasting.
1 Download
Last Update:
Apr 27, 2026 22:09 PM
Published:
Feb 01, 2026 12:40 PM
Category: