The FXCX Divergence Indicator for MT4 is a technical price-action tool designed to help traders identify potential trend reversals and price swing levels with high precision. By combining RSI divergence analysis with Exponential Moving Averages (EMA), it provides clear visual cues of market turning points, allowing traders to anticipate buy and sell opportunities effectively.
The indicator plots arrows directly on the chart, signaling areas where the market might reverse. It’s lightweight, clean, and leaves enough space for traders to use additional indicators for confirmation—making it ideal for both position trading and Scalping strategies.
How FXCX Divergence Works
At its core, the FXCX Divergence Indicator operates by detecting divergence patterns between price and the 21-period Relative Strength Index (RSI). Divergence occurs when price moves in one direction while RSI moves in another, signaling a potential loss of momentum and an upcoming reversal.
However, FXCX Divergence doesn’t stop there. To enhance the accuracy of its signals, it applies a background filter using crossovers between the 5 and 13-period EMAs. When both the RSI divergence and EMA crossover align, the indicator prints arrow signals on the chart—helping traders confirm whether the setup is bullish or bearish.
Interpreting FXCX Divergence Signals in MT4
Bullish Divergence Signal
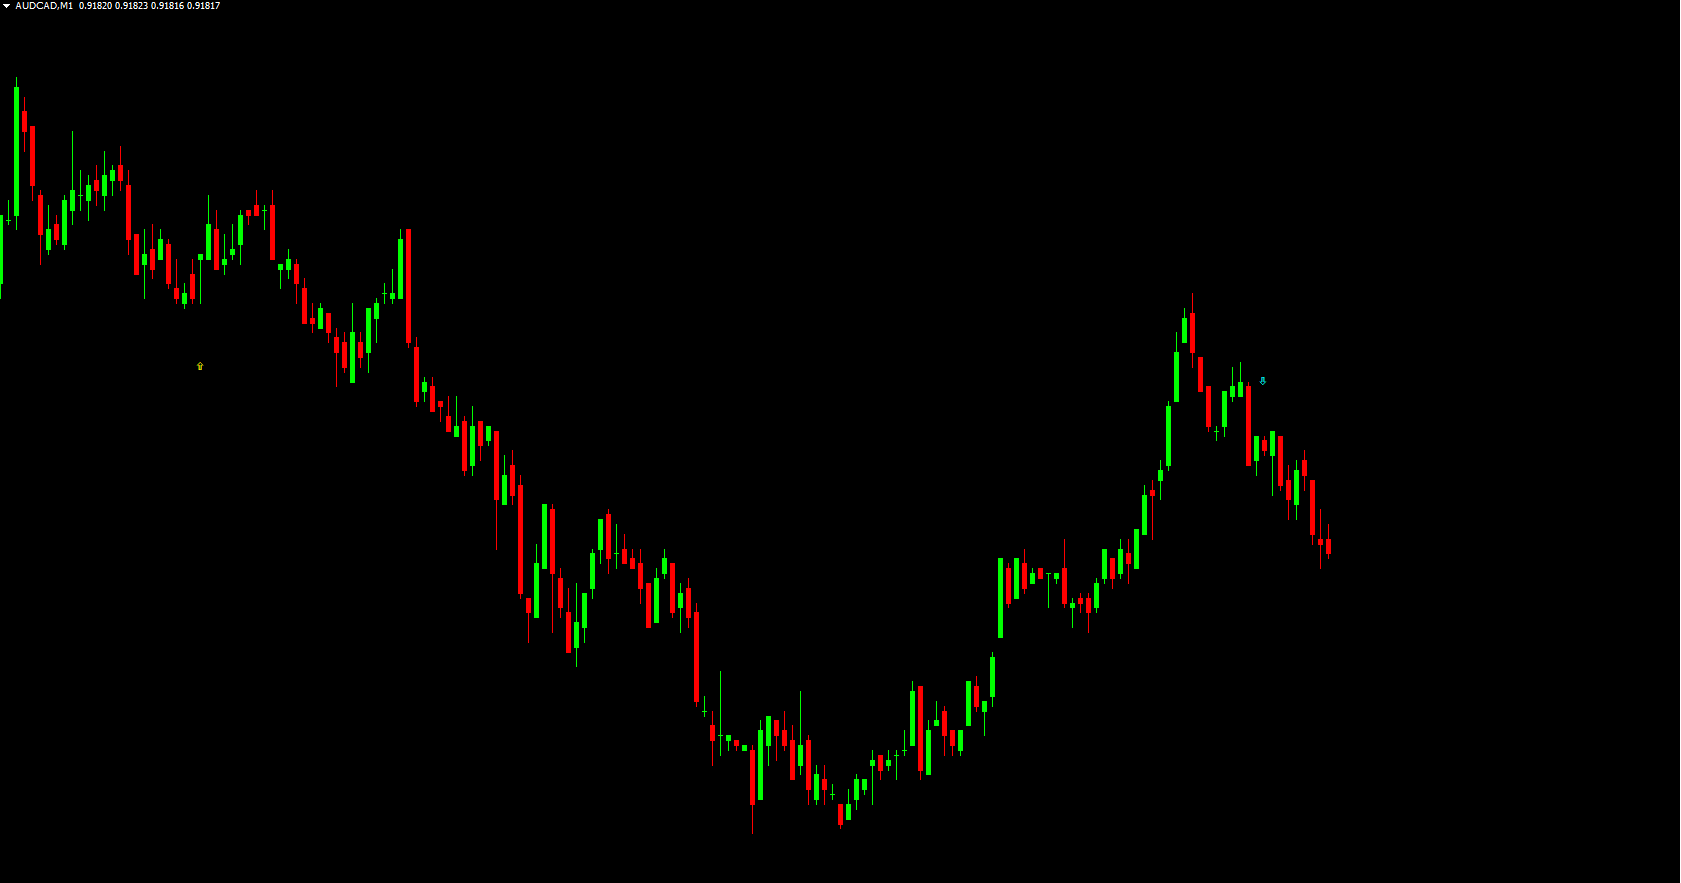
When the indicator plots a yellow arrow below the price, it represents a bullish divergence. This means that the RSI is rising while the price continues to fall, signaling a potential upward reversal. Traders can look for buying opportunities, especially when Price Action confirms upward momentum.
Bearish Divergence Signal
An aqua arrow above the price denotes a bearish divergence, suggesting that the RSI is falling while price continues to climb. This situation hints at a possible downtrend reversal or market correction.
By combining divergence signals with other trend-based indicators such as moving averages, traders can confirm the strength and reliability of the setup before entering trades.
Example of Trading with FXCX Divergence and Moving Averages
Consider a scenario where a 50-day EMA is added to your chart alongside the FXCX Divergence indicator:
When a bullish divergence (yellow arrow) appears while the price bounces above the 50 EMA, it indicates a strong buy signal.
Conversely, a bearish divergence (aqua arrow) forming below the 50 EMA confirms a potential sell setup.
This combination allows traders to filter out false signals and focus on high-probability reversals. The indicator is particularly effective on H1, H4, and daily charts, though it can also be used for scalping on lower timeframes.
Trade Management and Exit Strategy
FXCX Divergence focuses on entry identification rather than exits. As such, traders should use standard risk management techniques to protect profits and minimize losses.
Here are some exit suggestions:
Use a 1:2 risk-to-reward ratio for take-profit levels.
Apply a faster moving average (e.g., 10 EMA) to spot early trend reversals.
Consider price action patterns (like double tops/bottoms or engulfing candles) for additional confirmation.
Combining FXCX Divergence with these tools ensures you capture the best possible entry and exit points while maintaining a disciplined approach.
Why Traders Use FXCX Divergence
Divergence trading has long been favored among professional forex and stock traders because it identifies momentum shifts before price reacts. Traditionally, it required manual analysis, but FXCX Divergence automates this process, making it easier even for beginners.
Key advantages include:
Detects divergence automatically using RSI and EMA crossovers.
Generates clear, easy-to-interpret arrow signals.
Works on all major currency pairs, stocks, and indices.
Compatible with multiple timeframes and trading styles.
Lightweight design that complements other indicators.
Conclusion
The FXCX Divergence Indicator for MT4 simplifies one of the most powerful market analysis techniques—divergence trading. By blending momentum and trend confirmation tools into one visual system, it enables traders to spot high-probability reversals with confidence.
Whether you’re a seasoned trader or a beginner learning divergence trading, FXCX Divergence can enhance your MT4 setup significantly. Install it, experiment with demo accounts, and experience how accurately it highlights shifts in market momentum.
To explore more professional-grade indicators and trading tools, visit IndicatorForest.com — your hub for premium MT4 and MT5 resources.
FAQ
1 Download
Published:
Nov 13, 2025 00:33 AM
Category: