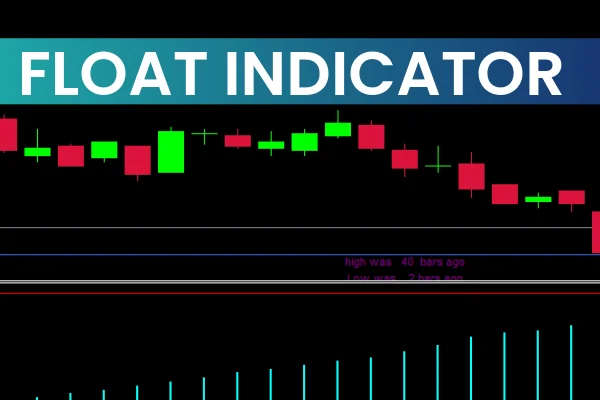
The Float Indicator is one of the market’s most advanced trend trading tools designed to help traders identify the beginning and end of market trends. By analyzing historical chart data and the current price movement, it visualizes key trend phases in a separate indicator window below the Price Action.
This makes it easier for traders to see not only where a trend starts or finishes but also how long ago the market’s highs or lows occurred. The Float Indicator also integrates DiNapoli and Fibonacci levels, offering deeper insight into potential retracement and reversal zones.
Whether you’re trading Forex pairs, commodities, or indices, the Float Indicator helps you understand the market’s rhythm and make smarter trading decisions.
How Does the Float Indicator Work?
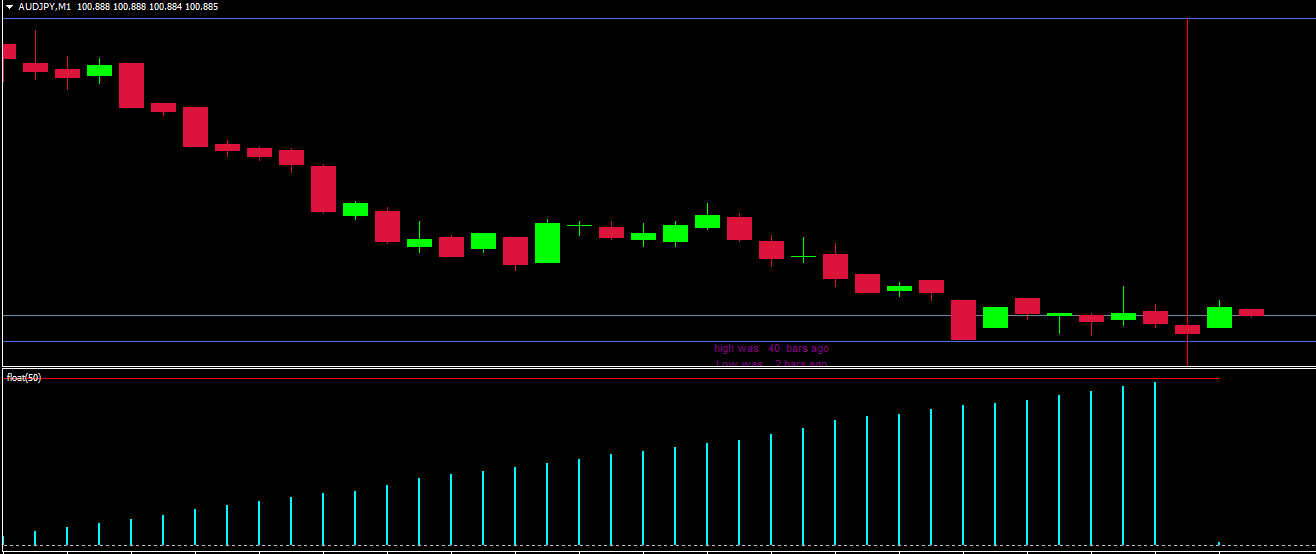
The Float Indicator operates by continuously scanning previous price bars to detect significant swing highs and lows. It then calculates how many bars ago these levels occurred and displays that data on the chart.
Trend Duration Analysis: It shows how long the current trend has been active.
Trend Start and End Signals: Marks where the last trend ended and where the next one begins.
Fibonacci & DiNapoli Levels: Helps identify correction and continuation zones.
This combination gives traders a clear picture of Market Structure, making it easier to enter or exit trades with better timing and reduced risk.
How to Use the Float Indicator in Trading
The main idea behind using the Float Indicator is simple — trade with the trend. You don’t need to predict market direction; you just need to follow the signals.
Step-by-Step Usage Guide
Identify Trend Direction: Observe the indicator window to see if the market is currently in an uptrend or downtrend.
Wait for a New Trend to Begin: The indicator shows when a new trend starts after a reversal.
Enter the Trade: Open a buy or sell position at the beginning of the new trend.
Monitor the Trend’s Progress: The indicator tells you how long the trend has lasted (for example, “Low detected 37 bars ago”).
Exit Strategically: Once the indicator signals a trend exhaustion or reversal, prepare to close your trade.
Float Indicator Trading Example
Let’s look at an example using the USDCHF currency pair.
According to the Float Indicator, the market’s low was 37 bars ago, and the high was 12 bars ago. This means that a new downtrend is forming below the price action.
A trader seeing this signal would open a sell position, riding the trend as it develops. The indicator clearly marks when the previous trend ended and when the next one begins, allowing for high-accuracy entries and effective risk management.
Advantages of the Float Indicator
Clear Trend Visualization: Easily see trend beginnings and endings.
Multi-Timeframe Compatibility: Works on short and long-term charts.
Incorporates Fibonacci and DiNapoli Levels: Perfect for technical traders who love precise setups.
Easy to Use: Ideal for both beginners and experienced traders.
Why Use the Float Indicator?
Using the Float Indicator allows you to stay aligned with market momentum. Instead of guessing when to enter or exit, you follow objective trend data. This not only improves your trading accuracy but also reduces emotional decisions.
To explore, download, or learn more about this tool, visit IndicatorForest.com — your trusted source for premium and free MetaTrader indicators.
Conclusion
The Float Indicator is an invaluable tool for trend-following traders. It highlights trend start and end points, integrates Fibonacci levels, and provides clear insight into market rhythm. By using it correctly, you can confidently ride trends from start to finish and improve your trading performance.
Start using the Float Indicator today and experience smarter trading decisions — only at IndicatorForest.com.
Published:
Nov 03, 2025 05:16 AM
Category: