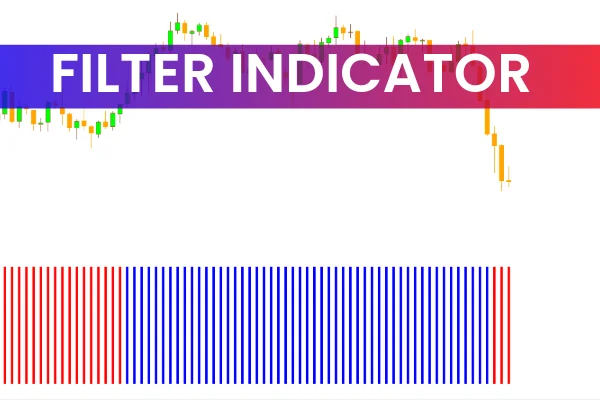
The Filter Indicator for MetaTrader 4 (MT4) is a trend Momentum Indicator that helps traders visualize the strength and direction of the market trend. It displays red bars to represent bearish momentum and blue bars for bullish momentum.
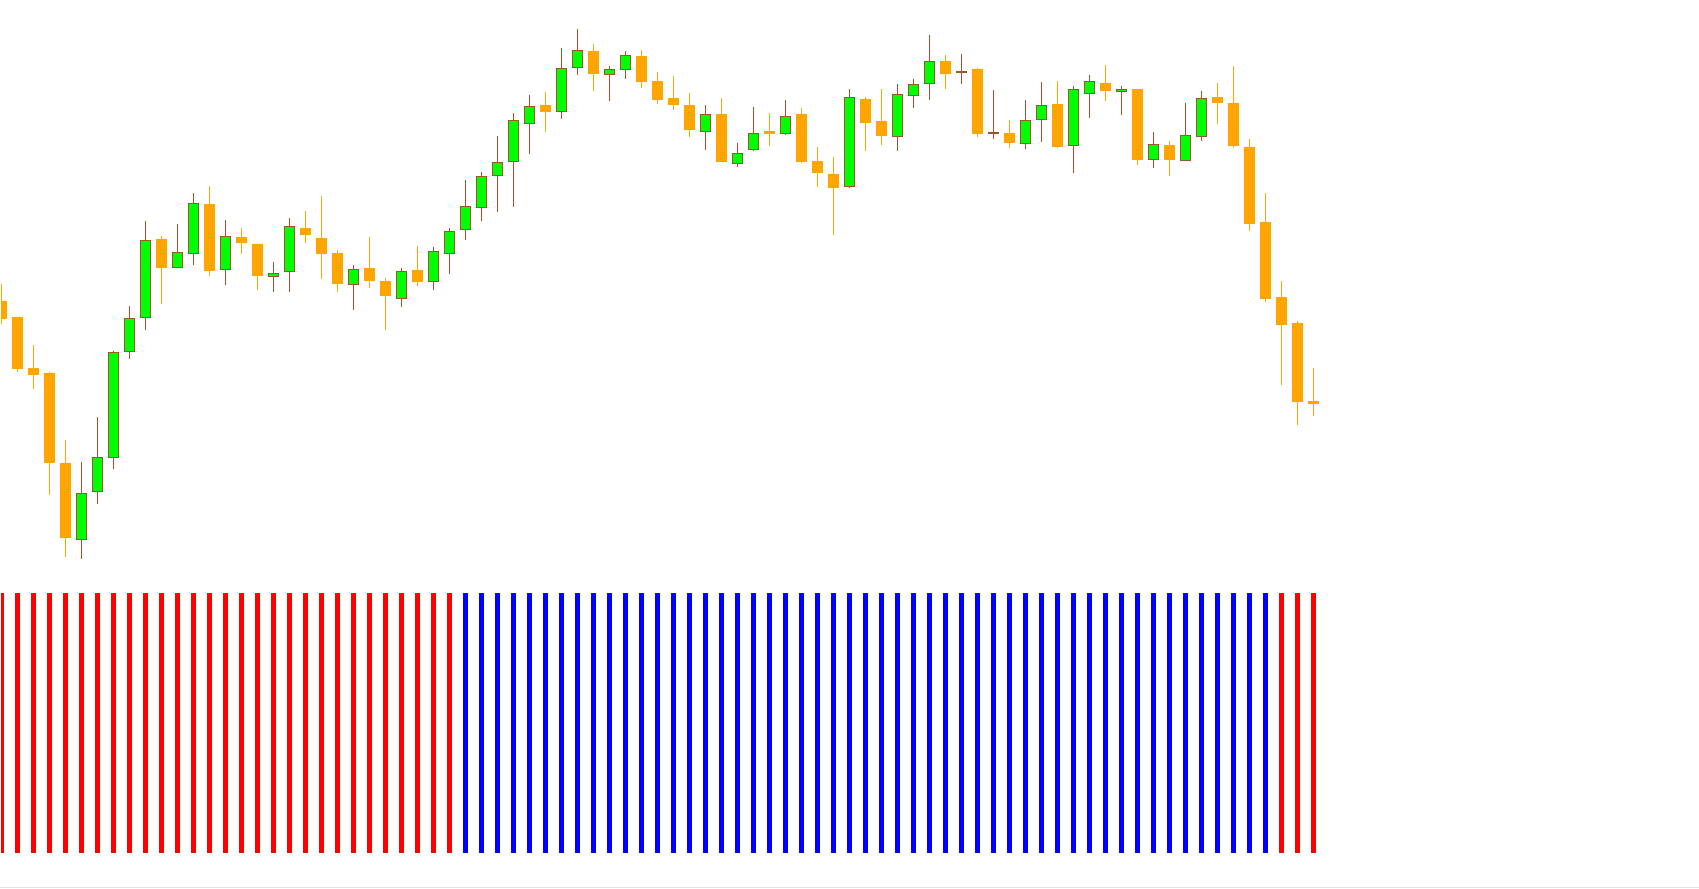
Unlike standard oscillators or moving averages, this indicator is plotted below the main price chart as a histogram, making it easy to monitor trend changes at a glance.
Although it can be applied to all chart timeframes, it is most effective on higher timeframes (H4, D1, W1) because these reduce market noise and provide clearer, more reliable trend signals.
How the Filter Indicator for MT4 Works
The Filter Indicator analyzes price data to measure the momentum strength of the current trend. It doesn’t provide direct buy or sell signals — instead, it shows visual cues about the market’s current state.
Blue Bars: Indicate bullish market momentum. Price is likely to move upward, and traders should look for buying opportunities.
Red Bars: Indicate bearish market momentum. Price is likely to move downward, suggesting selling opportunities.
Color Change: When the bars change from blue to red (or red to blue), it signals a potential Trend Reversal or momentum shift.
This makes the Filter Indicator a trend-following and reversal-detection tool in one simple display.
How to Use the Filter Indicator for MT4
Identifying Trend Direction
When blue bars appear, the market is gaining bullish strength — look for buy setups.
When red bars appear, bearish pressure dominates — focus on sell setups.
Detecting Trend Reversals
A change in color often precedes a shift in trend direction:
Blue → Red: A possible bearish reversal — prepare for short entries.
Red → Blue: A possible bullish reversal — consider long entries.
Combining With Other Indicators
The Filter Indicator works best when combined with other technical tools to confirm signals:
RSI (Relative Strength Index): Confirms overbought/oversold conditions.
MACD (Moving Average Convergence Divergence): Confirms momentum and crossover strength.
Moving Averages: Help define the long-term market trend for alignment.
For instance, if the Filter Indicator turns blue while RSI exits the oversold zone, this provides a strong confluence for a buy setup.
Example Setup
Let’s consider a USD/JPY H4 chart example:
When the Filter Indicator begins plotting blue bars, it shows increasing bullish momentum.
Wait for a bullish candle close on the price chart to confirm direction.
Enter a buy trade at the candle’s close.
Stop-loss: Below the previous swing low.
Take profit: When the bars switch to red or near a major resistance level.
For a sell setup, follow the same logic in reverse when red bars appear.
Benefits of Using the Filter Indicator for MT4
Clear Visual Signals: Simple color-coded momentum display for easy interpretation.
Noise Reduction: Works best on higher timeframes to filter out false signals.
Trend Reversal Alerts: Detects early signs of changing market direction.
Beginner-Friendly: No complex parameters or settings — suitable for all traders.
Versatile Use: Compatible with most MT4 trading strategies and indicators.
Best Practices
Use the Filter Indicator on H4 and D1 charts for more accurate signals.
Combine it with Price Action analysis or support/resistance levels for better entries.
Avoid trading solely on color changes without confirmation from other indicators.
Always use stop-loss and proper risk management.
Conclusion
The Filter Indicator for MT4 is a simple yet powerful tool that helps traders identify bullish and bearish momentum using red and blue bars. It is ideal for detecting Trend Continuation or reversal opportunities and works across all timeframes.
By combining it with confirmation tools such as RSI or MACD, traders can enhance signal accuracy and make more informed trading decisions.
Download the Filter Indicator for MT4 today at IndicatorForest.com and start improving your trend analysis with visual momentum tracking.
1 Download
Published:
Nov 06, 2025 11:25 AM
Category: