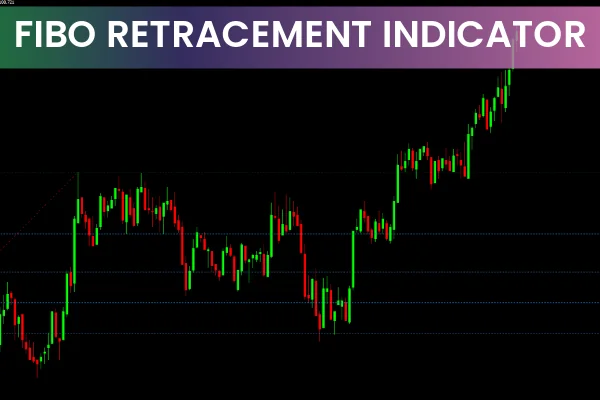
In volatile forex markets, it is often difficult to distinguish trend waves from retracement waves. The Fibonacci Retracement Indicator for MT4 solves this problem by automatically plotting Fibonacci levels on your chart, helping traders identify pivot points and anticipate where the primary trend is likely to resume.
This free indicator filters out flat market phases and focuses only on active price movement, making it a reliable tool for Scalping, intraday trading, and long-term strategies.
Fibonacci Levels Explained
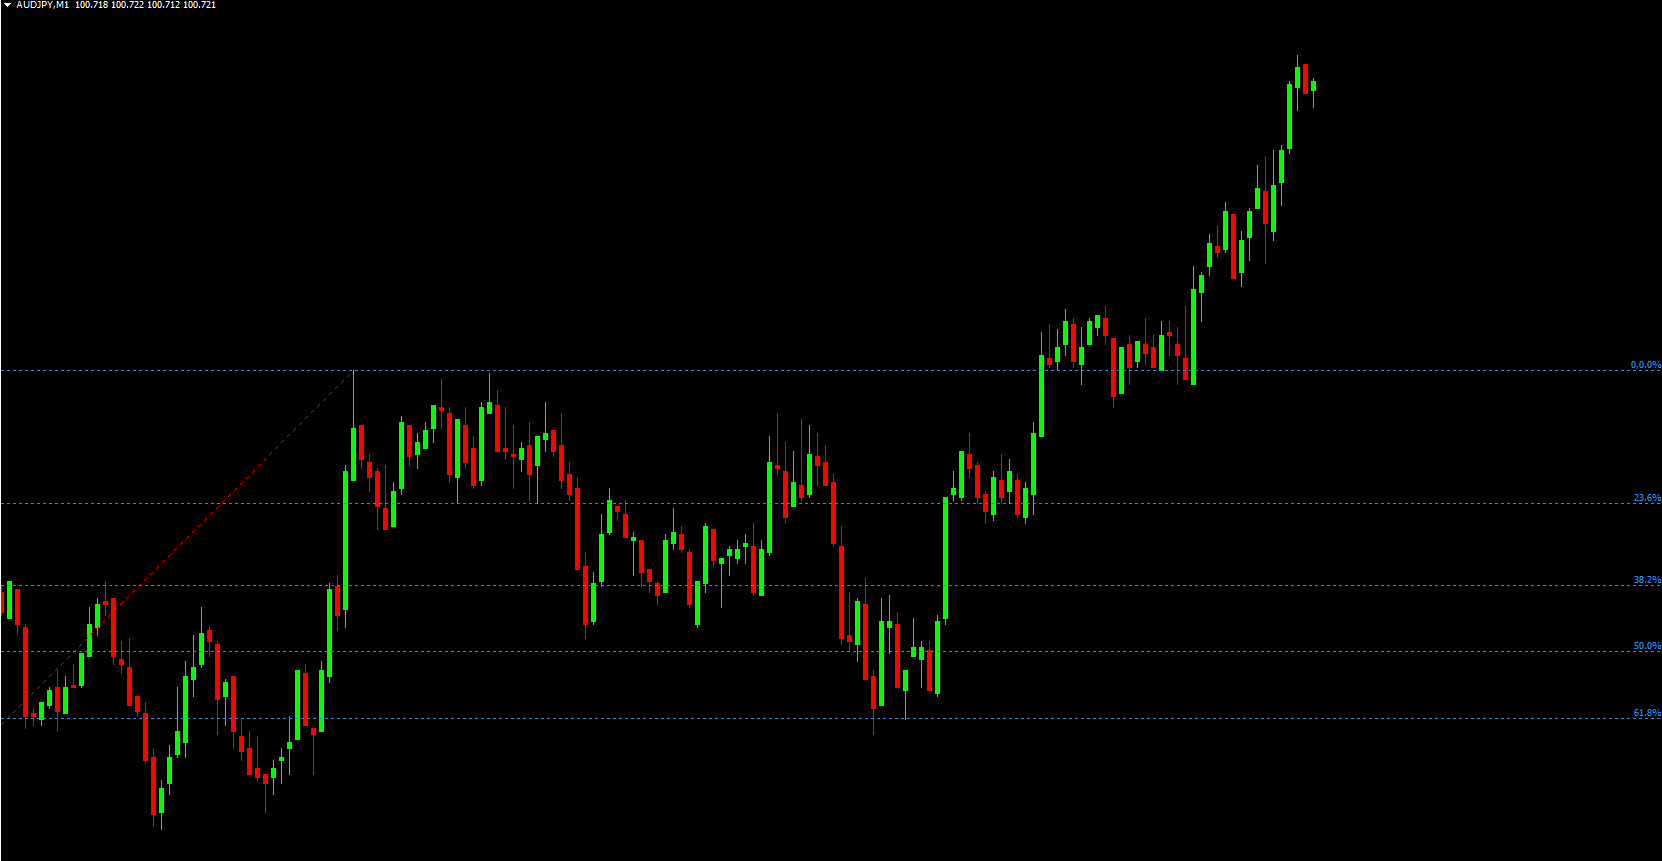
The Fibonacci levels are shown as percentages, calculated from the primary trend’s high and low points. The key levels included in the indicator are:
100%: Starting point for Fibonacci placement.
61.8% (Golden Ratio): Often complements the 50% level; pullbacks slowing near this zone may indicate a pivot.
50%: A common pivot point as traders secure profits during retracements.
38.2%: Indicates active trader participation; pivot points often occur here.
23.6%: Rarely a pivot level; market participants typically wait for deeper pullbacks.
0%: Ending point of the Fibonacci placement.
The 78.6% level is excluded from this indicator since pullback waves rarely reach this level before the trend resumes.
Key considerations:
Strong trend before retracement: Weak pullbacks indicate a higher likelihood of trend resumption.
Pullback stronger than trend: Could signal the start of a new opposite trend.
Confluence with round numbers or other indicators: Increases the chance of Trend Continuation.
How to Use the Fibonacci Retracement Indicator
Combine with Other Indicators
The Fibonacci Retracement should be used alongside other tools such as trendlines, moving averages, or oscillators.
The more signals aligning at a Fibo level, the higher the probability of a successful trade.
Spot Pivot Points
Identify where the retracement slows near 50% or 61.8% levels for potential entry points.
For selling trades, confirm with trendlines and consider placing Stop Loss beyond the trendline.
For buying trades, observe pullbacks near lower Fibo levels (e.g., 38.2%) and place Stop Loss beyond support lines.
Timeframe Flexibility
The indicator works on any timeframe – scalping, intraday, or long-term trading.
If levels do not redraw after switching timeframes, remove and reapply the indicator to reset it.
Market Sentiment Analysis
The Fibo levels also help gauge overall market sentiment, allowing traders to predict likely price movement based on retracement strength.
Advantages of the Fibonacci Retracement Indicator
Automatic plotting of key levels reduces manual errors.
Filters flat markets, focusing only on active trends.
Works across timeframes for multiple trading styles.
Assists in identifying pivot points and entry zones with high probability.
Enhances risk management by clearly defining Stop Loss areas.
Conclusion
The Fibonacci Retracement Indicator for MT4 is an indispensable tool for forex traders aiming to spot pullbacks and pivot points within active trends. By combining Fibo levels with additional indicators like trendlines or support/resistance levels, traders can:
Identify high-probability trade entries and exits.
Understand market sentiment and potential trend resumption.
Improve risk management with defined Stop Loss placement.
Download the Fibonacci Retracement Indicator for free from IndicatorForest.com and enhance your ability to trade pullbacks effectively.
FAQ
4 Downloads
Published:
Nov 10, 2025 04:12 AM
Category: